
Review and work with your results
Analyze results in the table
Once your project is complete, you can review and organize the results directly in the table view.
This step allows you to sort and filter the tested locations using different criteria, making it easier to identify the most relevant sites. You can also select specific locations for further use, such as exporting results or creating new simulations.
Sort and filter results in the table
You can use the sorting and filtering options in the table to refine your analysis.
Sort results
To sort the table, click directly on the column header you want to sort by.
Each click changes the sorting order:
- Low to high
High to low
- No sorting

This allows you to quickly compare locations based on a specific indicator, such as predicted sales or net brand impact.
Filter results
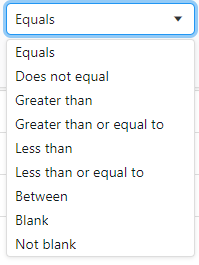
To filter a column, hover over the column header and click the filter icon.

You can then choose from the available filtering options for that column. 
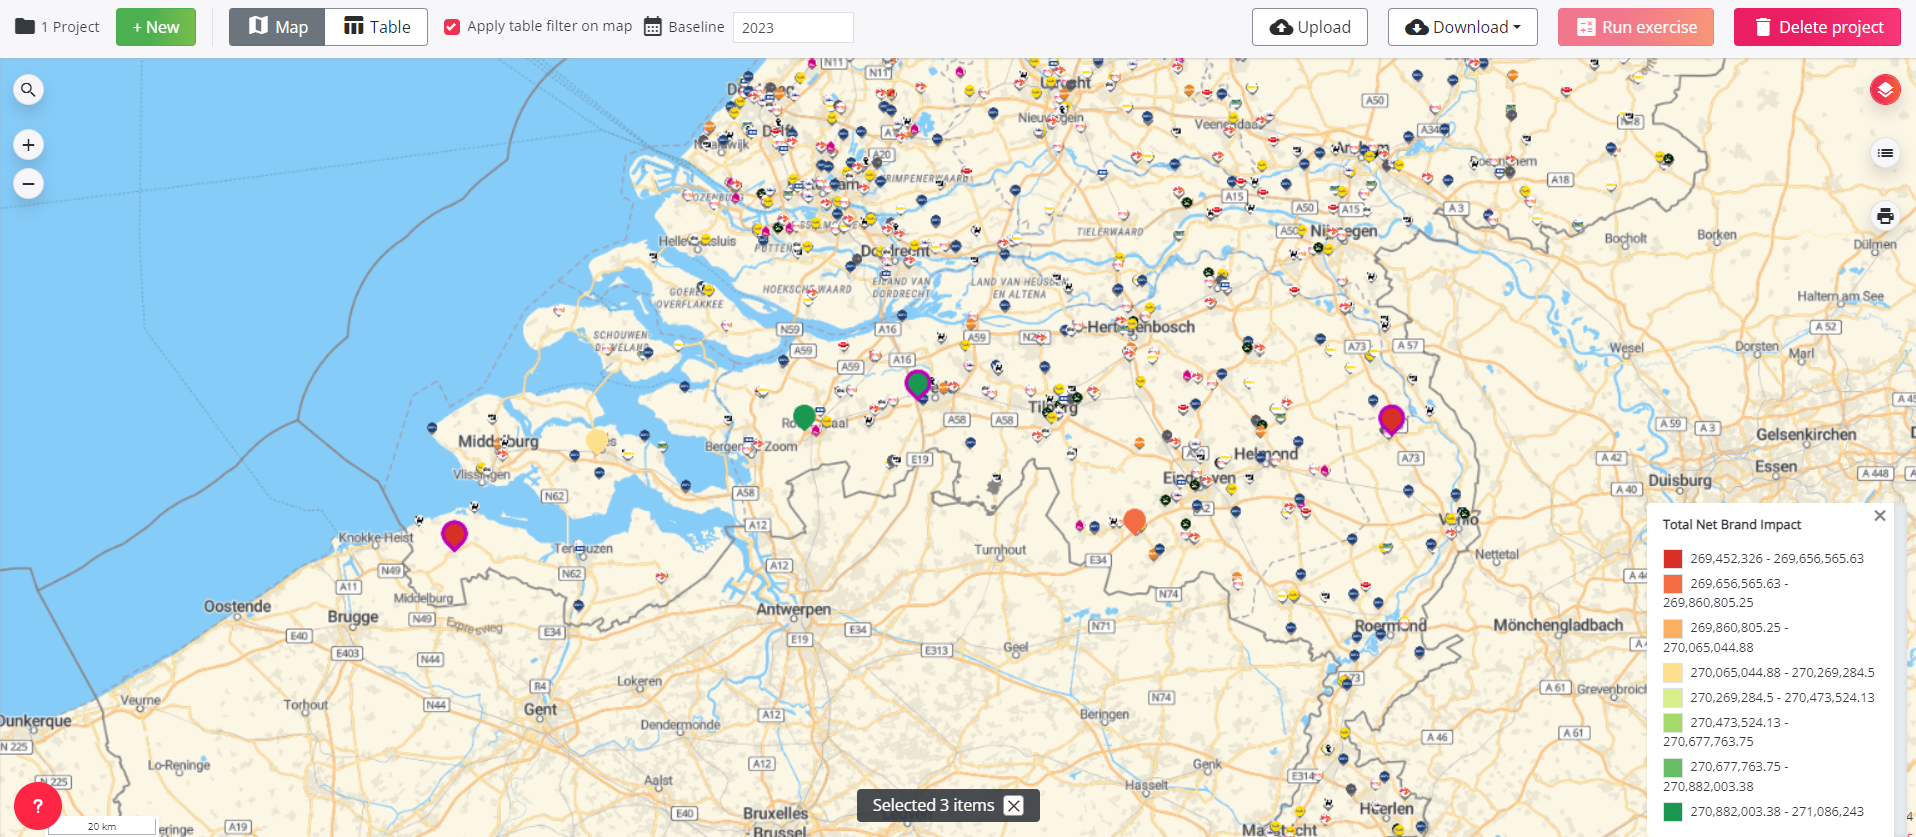
Apply table filters to the map
If you have applied filters in the Table view, you can also apply the same filters to the Map view.


To remove a filter, go to the filtered column, click the filter icon again, and reset the selected filter.
Select locations for further analysis
After analyzing the results, you can select the locations you want to keep for exporting or for creating new simulations.
There are two ways to select locations: from the table or from the map.
From the table
Select the checkbox on the left side of the location row in the table.
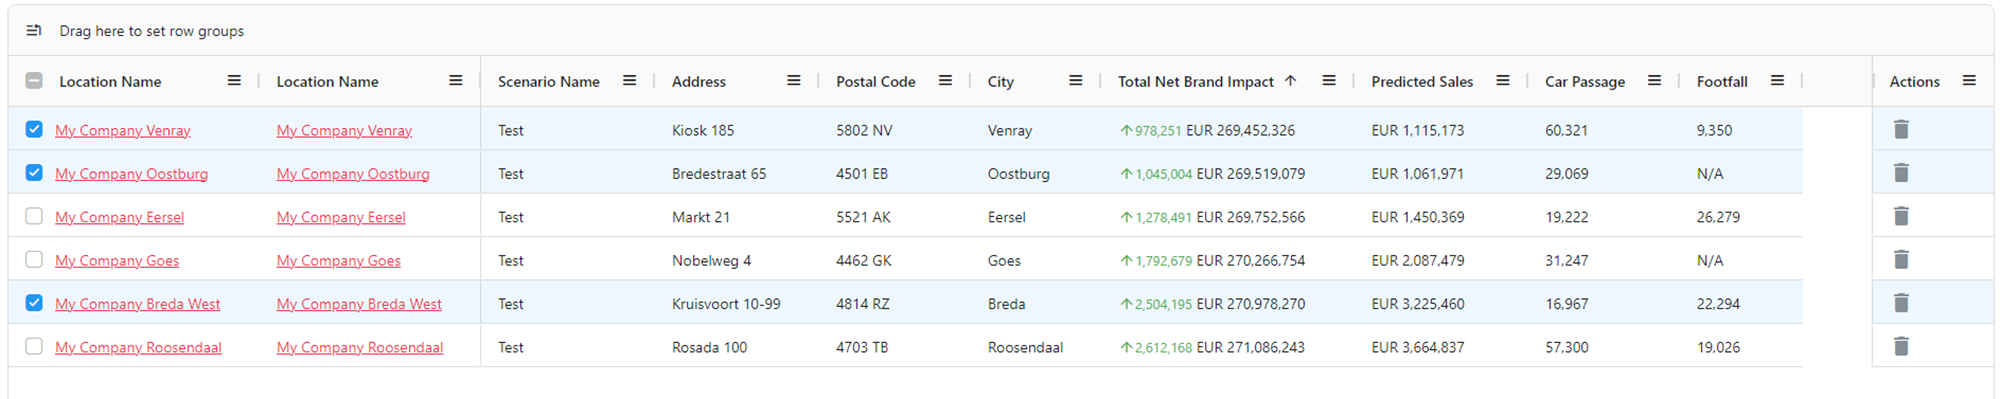
When you go to the Map view, the selected locations are highlighted in purple. Below the map, a message shows how many locations are selected, for example: Selected X items.
From the map
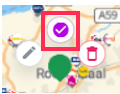
The selected location will be highlighted in purple on the map. It will also be selected automatically in the table.

Please note that the selection is temporary. If you refresh the page, the selected locations will no longer be highlighted.
Selecting locations allows you to manually create a shortlist of the most promising opportunities.
Retain the best configuration from an optimal location characteristic project
If a location was tested with multiple configurations in the same batch run, the table can help you identify the best-performing configuration.
To do this, group or sort the results by location name and compare the predicted sales for each configuration.
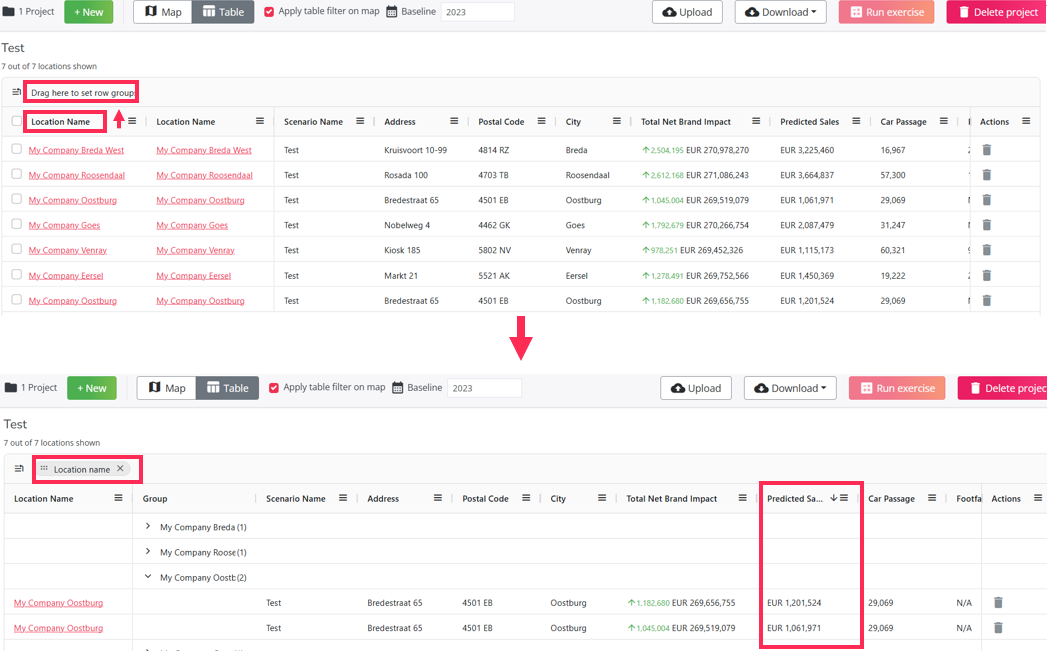
You can then retain the configuration with the best result in terms of predicted sales.