
How to benchmark your locations and understand the drivers of the model?
With our predictive models you are able to map the full potential of every location and every neighborhood.
Additionally, it can be interesting to compare this predicted performance with their current performance and pinpoint underutilized locations and regions.
The frameworks configured in the Location Performance module will help you find an answer to these questions, as well as help you understand all the relevant drivers in the model that have an impact on the predicted performance.
1. Benchmarking framework (existing network)

GOAL: Benchmarking the predicted outcome (= benchmark) for each existing location with their current performance and identifying underutilized locations.
Building blocks
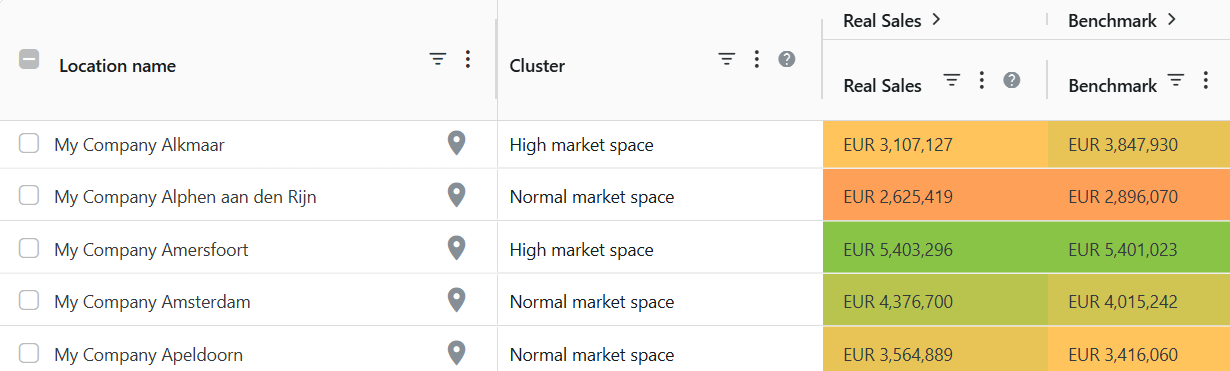
- Benchmark: estimation of the predicted potential for each existing location, considering the current macro and micro environment (corresponding to a certain data period)
- For each existing location, we compare the real sales data to this benchmark. By measuring the deviation between the two, we can distinguish different location classifications.
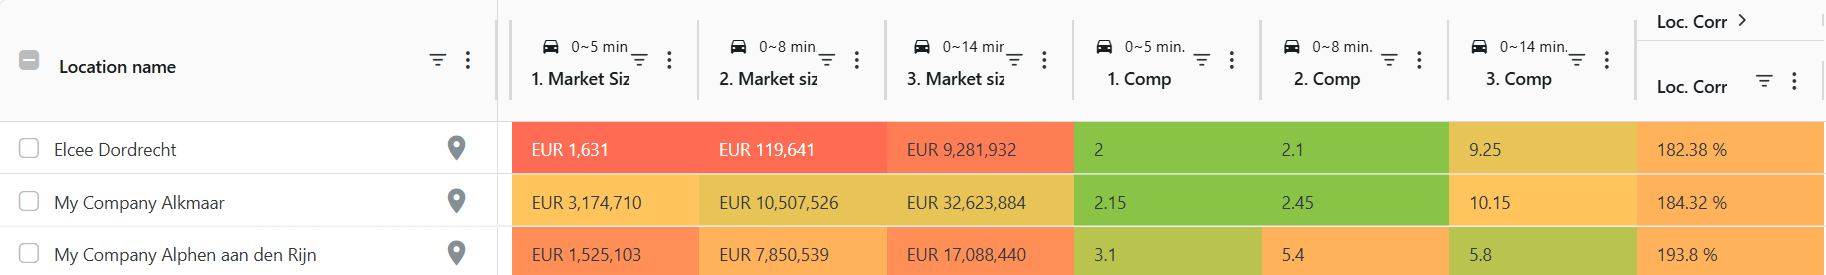
- Drivers of the predictive model*: these are the columns (right from the location classification column) in the framework displaying the macro and micro environment indicators that define the predicted performance of each location. (*below you can find a brief summary of these indicators)
How to use
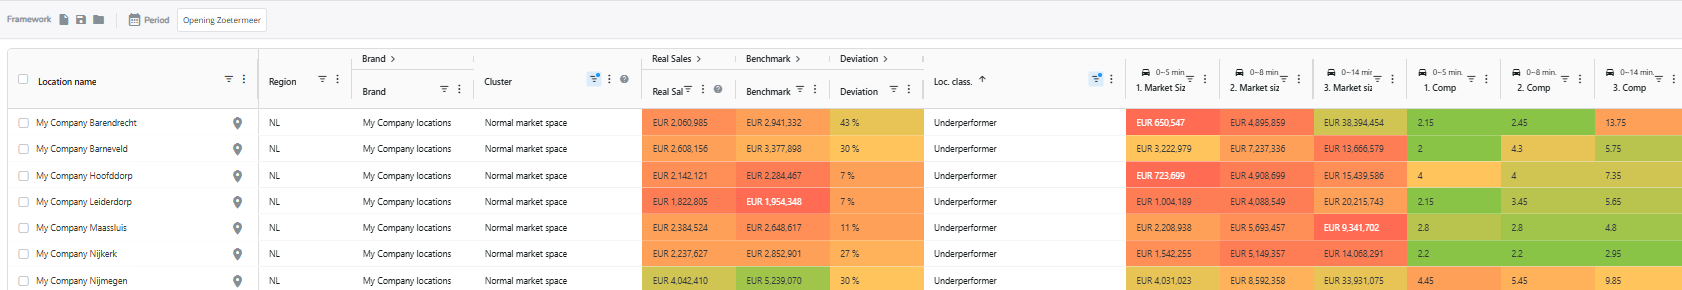
- For each location in the framework; analyze the real sales and the benchmark column. The deviation column displays the deviation percentage.
- To understand the benchmark of a certain location, analyze the columns displaying the drivers of the model (i.e. market size, competitive pressure, willingness to travel and all relevant location characteristics).
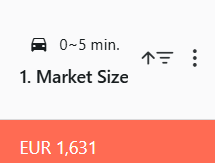
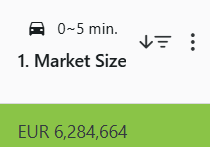
- You can easily sort the data for a specific column or driver by clicking on the column name. Clicking on the column name will sort the data. Depending on the little arrow next to the name, the data will be sorted:
- in ascending order
- or in descending order
This way you'll see which locations in your network have the highest or lowest value for that driver. Make sure to apply a relevant filter if you don't want to sort values for you complete network, but only for the locations you want to benchmark (eg. cluster)
- in ascending order
- The colors within the framework can be understood by analyzing each driver or column. The color scale is determined by weighing each location against the average of that column for all locations displayed in the framework. Be aware that the color scale of the column depends on the filter(s) you've activated.
Green indicates that your location performs better than the average on that indicator (if applicable, for a given filter), while red indicates that your location performs worse than the average.
- You can easily sort the data for a specific column or driver by clicking on the column name. Clicking on the column name will sort the data. Depending on the little arrow next to the name, the data will be sorted:
- If clusters (homogenous groups of locations with similar macro and micro environment indicators) were defined for your network, you can identify for each cluster which locations can still grow. By investigating the possible underlying causes, you can develop specific actions:
- Actions for underperformers: identify growth opportunities
- Actions for unprofitable location w/o growth potential: explore real estate opportunities to enhance profitability

2. Benchmarking framework (new locations)

GOAL: Analyzing the drivers of our predictive model & benchmark it with existing locations, in order to have a better understanding of the predicted outcome for your new (simulated) locations.
Building blocks:
- Cluster: Each location is categorized into a cluster based on similar characteristics, such as macro and micro environment indicators.
- Predicted sales: estimation of the predicted sales for each location
- Drivers of the predictive model*: these are the columns in the framework displaying the macro and micro environment indicators that define the predicted potential of each location.(*below you can find a brief summary of these indicators)
How to use
This approach aligns closely with the previous framework; however, the current focus is on benchmarking the new location(s) (indicated with a 
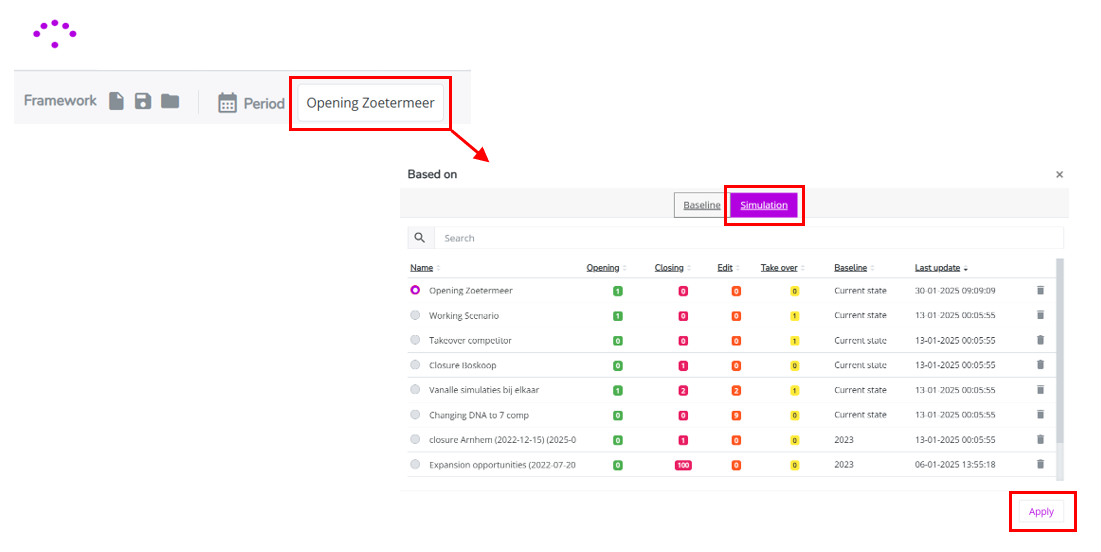
- Load the simulation with the new location(s) in the left upper corner. Select the right simulation and click on Apply.
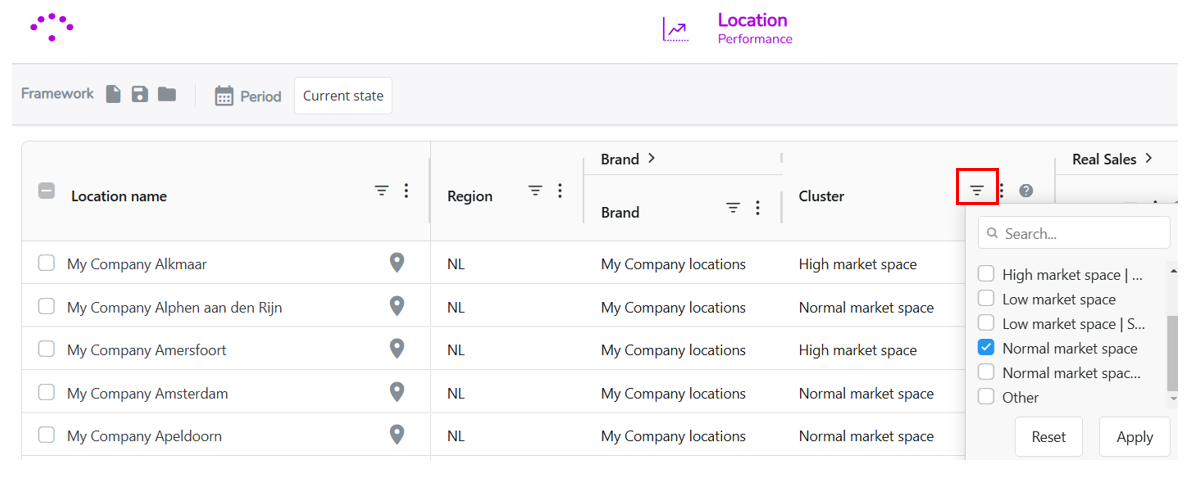
- Make sure to display only the relevant locations (e.g. to benchmark the new location with) by using the configured location filters. To select the right filter options, you can click on the
When you've selected a filter, this will be marked as a blue icon - Examine now the relevant macro- and micro environment indicators that have an impact on the predicted outcome and benchmark them with the other locations. Sort each column from high/low or low/high by clicking on the column name. This way you'll easily see how the new location relates to the others for each specific performance driver(column).


3. Opportunity framework (not by default configured)

GOAL: Uncovering the causes of underperforming locations and define actionable strategies. Exploring the real estate possibilities for unprofitable locations.
Building blocks:
- Similar to the other tabs, we maintain columns for location classification and cluster, but these columns are now expandable to reveal the data upon which they are based. Within the filter options in the framework, you can filter both on location classification and/or cluster.
- Extra explanatory sales KPIs: These key performance indicators (KPIs) are categorized into areas such as activation, loyalty, and conversion. Each category can be expanded to reveal the underlying data.
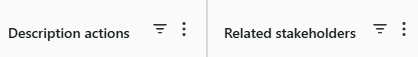
- Action descriptions: As you navigate to the right, you will find detailed descriptions of the recommended actions to be implemented in collaboration with relevant stakeholders. These recommendations are based on straightforward ruling logic and should be validated by the customer.

How to use
Read the following article: Which actions can you take for underperforming and/or unprofitable locations ?
*The indicators used by the predictive model are different for each customer and depend on the customer's preferences.