
Finding whitespots in your network
Maybe you don't have a clue on where to expand next with your current network. By displaying certain map layers in the platform, you could be able to find some whitespots yourself. This article will elaborate on how you can identify locations with a viable market space and promising location characteristics.
Step 1: Go to Location Planning.
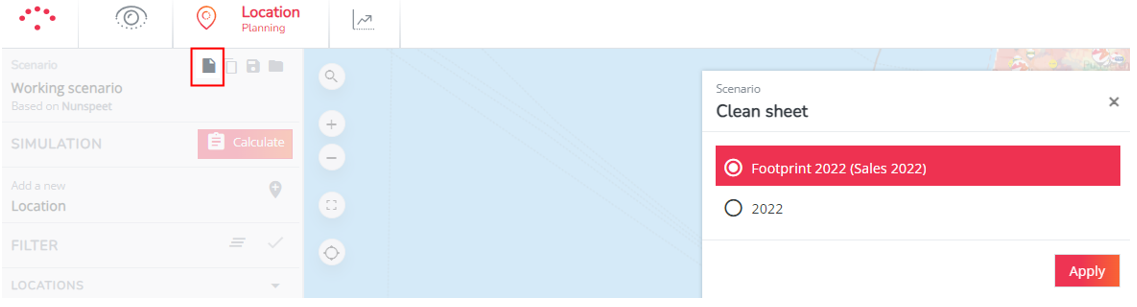
Step 2: Visualize your sales network. Click on the start a new simulation in the left settings bar, select the most recent current state period. We assume here that your current state period is kept up-to-date and contains all recent changes.
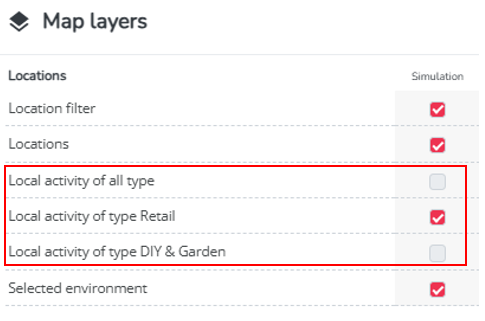
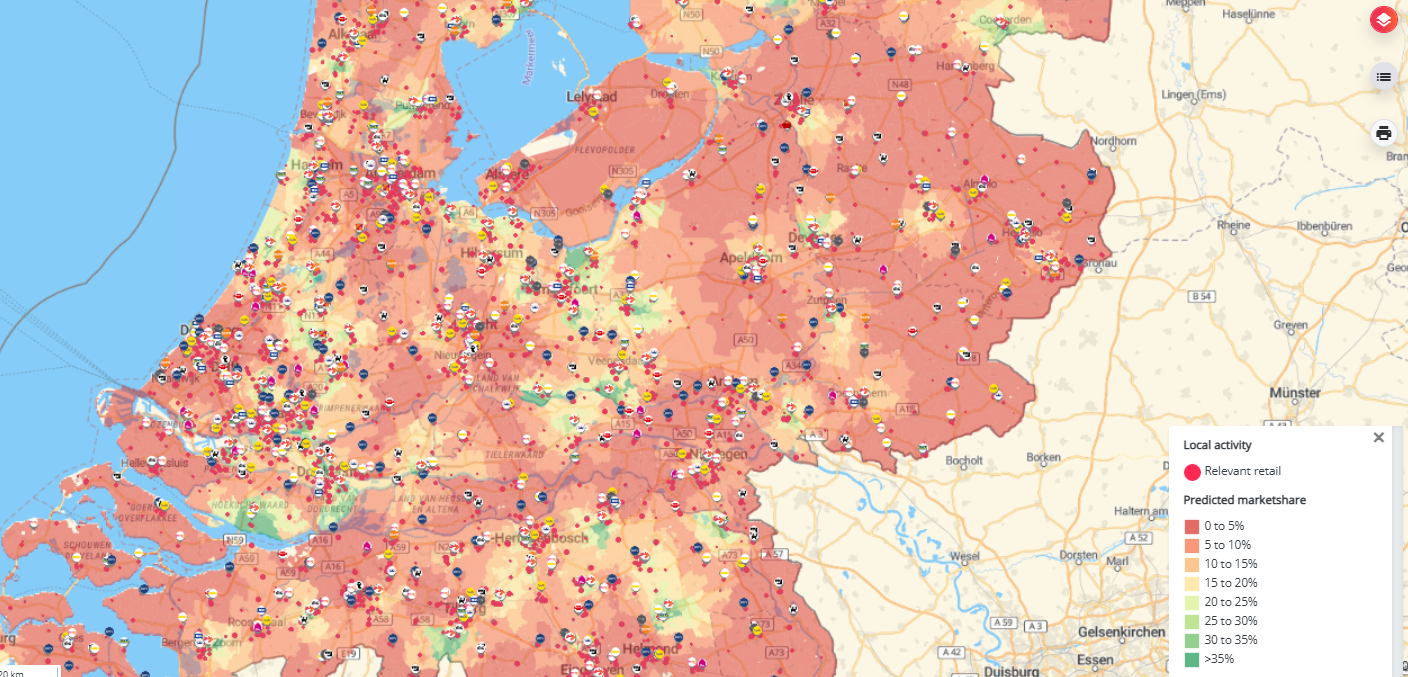
Step 3: Display relevant map layers. Click on Map Layers () in the top right corner of the map. The following map layers are interesting to activate at the same time;
- Select the type of local activity that is most interesting to be located next to (highest cross-visit potential). In case multiple are important, you can select those types or just all types.
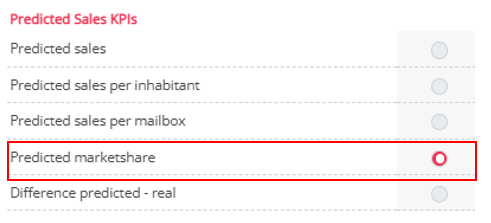
- Select the predicted market share; this will display per zone the market share (in %) you should be able to reach (as calculated by our advanced gravity model) with your existing network. These percentages are calculated by dividing the predicted sales for a zone by the calculated market size in that zone.
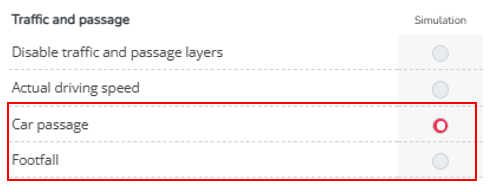
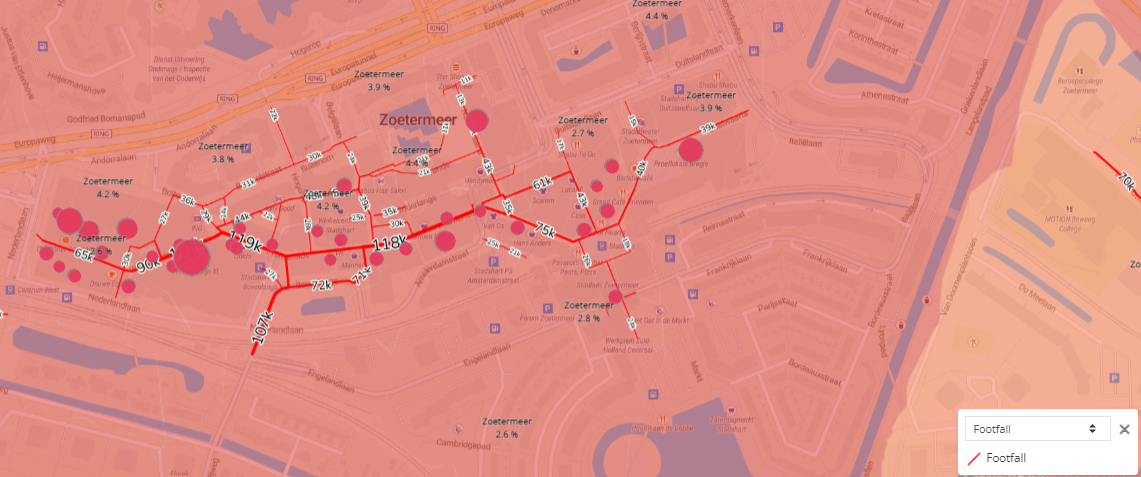
- If relevant - select the car passage (for non-urban areas) or footfall (for shopping areas) layer, depending on what is most interesting for you. This is of course only relevant if the passage is an important driver for location performances. (also not by default configured).
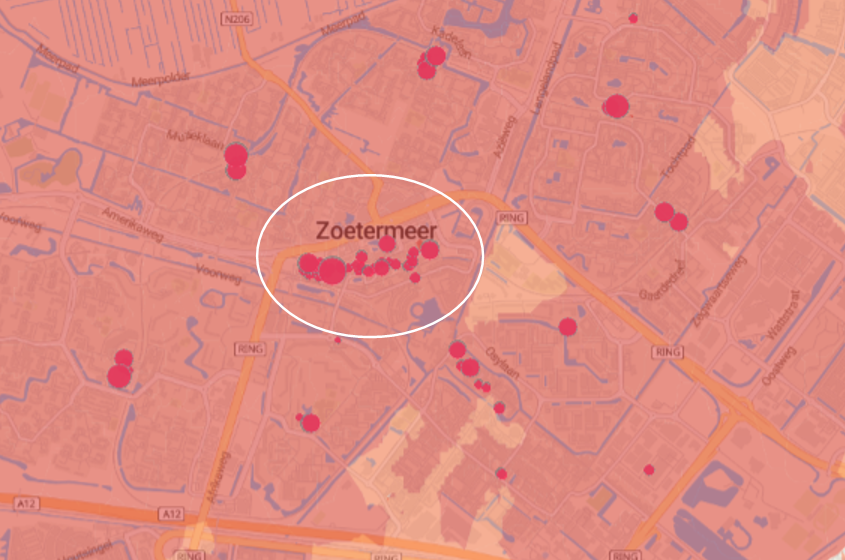
Step 4: Now zoom in on interesting search areas:
- This is where your predicted market share is rather low, the red coloured zones on the map. This relative map layer takes into account all important drivers of the model: market size, willingness to travel, competitive pressure and location characteristics. So having a low predicted market share means there is still room for your current network to expand. Be aware that zones where fewer people live also turn red. This is because the market size there is low (low predicted sales / low market size= low predicted market share). It's good to exclude those areas (you could take a screenshot of the map layer 'market size' first to compare both map layers at the same time).
- This is where you have a dense cluster of relevant local activity. More relevant local activity within a certain distance imply higher estimated cross-visits (visibility indicator).
- If relevant - this is where you have high passage or footfall. This might be an important performance indicator in terms of visibility.
Step 5: Based on the above, you can identify interesting areas where you would want to test a new location. To test a new location in such area, drag and drop the location marker from the left settings bar to the area on the map where you want to test it.
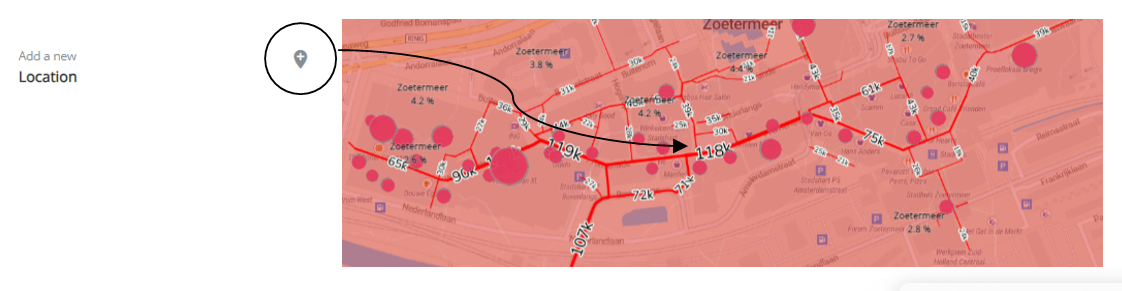
Step 6: In the pop-up window that will open, you can already check the estimated crossvisits and car passage and/or footfall estimation, which are automatically calculated. You can leave all location characteristics on neutral unless you have already a good indication of the right value. Press apply to add the location to the network.
Step 7: Press 'Calculate' to analyze the results.
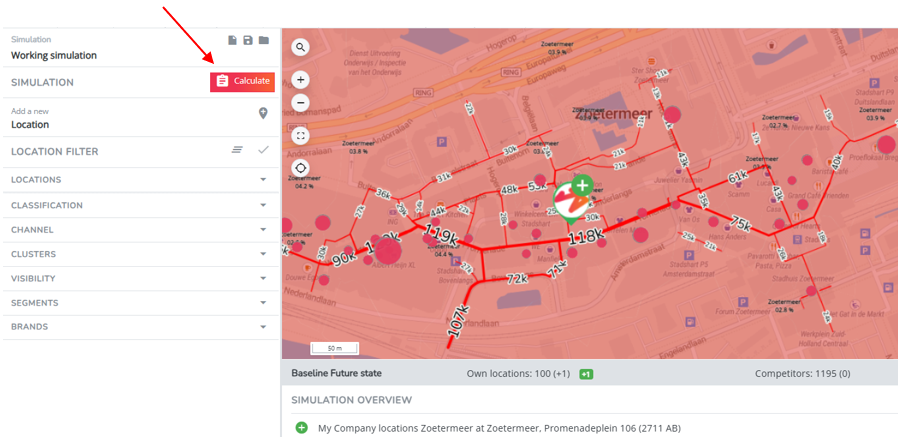
Important remark ! If you want to test multiple cases like this, this can be quite a time-consuming exercise. We can help by automating this process and testing all potential alternatives through a network optimization analysis. Contact support@retailsonar.com for more info.