
Simulate new local activity & analyze the impact
Use this guide when you want to simulate the impact of a future local activity near your own or competitor locations.
A local activity can be, for example, a future retail park, attraction, or other place that may influence cross visits in the area.
When should you use this?
Use this option when the local activity is part of a future scenario.
If the local activity already exists in real life but is not yet available in your platform, add it to the baseline period via: Data Management > Local Activity > Location Management (if you have power user rights)
This ensures the activity becomes part of your actual baseline situation instead of only being simulated.
Step 1: Go to the Location Planning module.
Open the simulation in which you want to add the new local activity, or create a new simulation.
Step 2: Add the new local activity to the map in one of two ways.
Option 1: Drag the location marker from the left side panel and drop it on the correct position on the map. Make sure you have zoomed the map on the right area already.

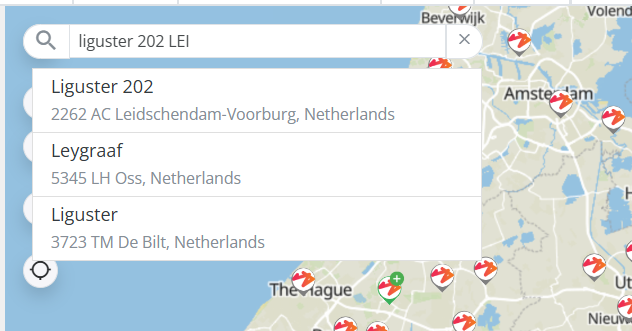
Option 2: Enter an address or place name in the search bar on the map. Select the right address. Click once on the orange marker that appears on the map.
Adding multiple activities at the same site
If the future development includes multiple local activities, add each activity separately.
For example, when simulating a new retail center, add a separate local activity for each relevant activity type instead of adding one generic activity for the entire retail center.
This allows the platform to calculate the impact based on the specific local activity types included in the simulation.
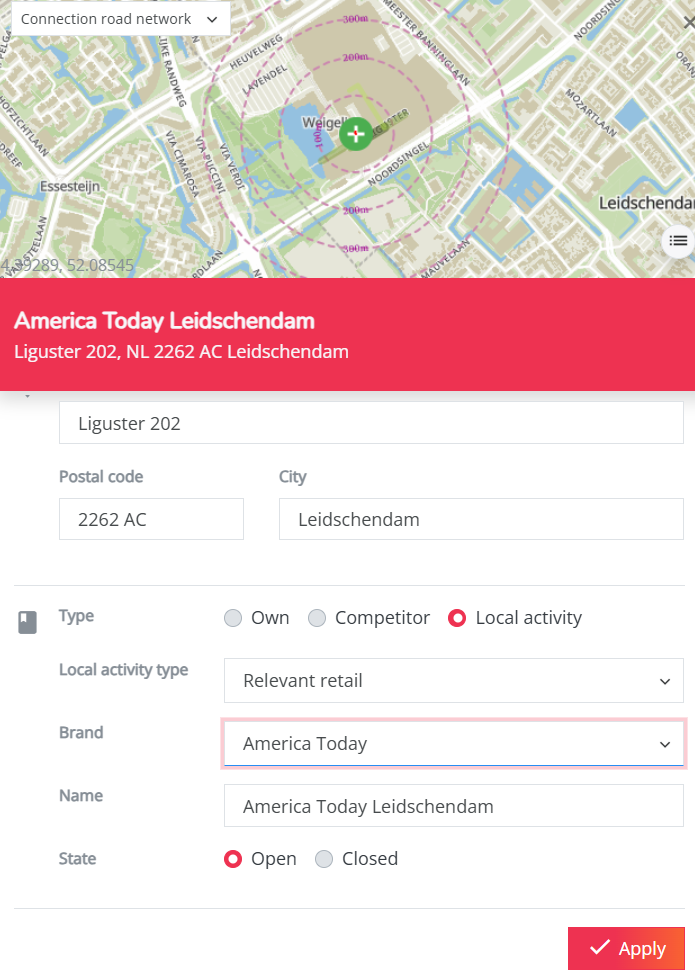
Step 3: After placing the marker, a pop-up window appears. In this window, fill in the required information.
| Field | What to select or enter |
|---|---|
Address | Check the address and adjust it if needed. Changing the address does not change the marker position on the map. |
Location type | Select Local activity. |
Local activity type | Select the relevant type of local activity. |
Brand | Assign a brand. |
Name | Add a name. A default name is suggested, but you can edit it. |
State | Select Open to simulate a new opening, |
Click Apply.
Step 4: Check the estimated destination visitors
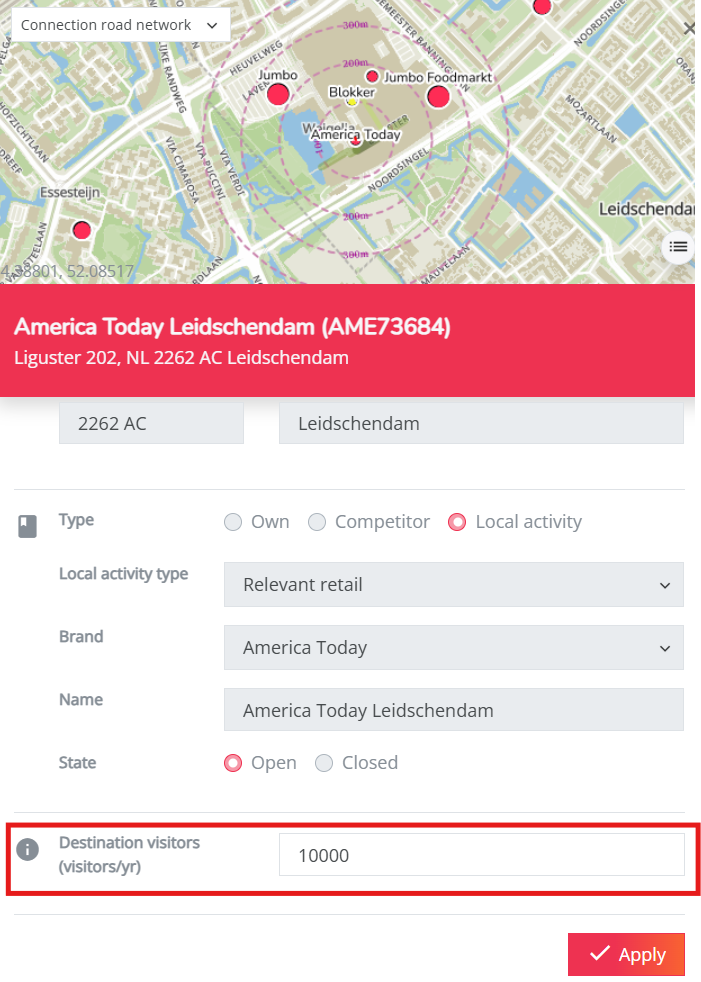
A second pop-up window appears with the estimated Destination visitors. This value represents the estimated number of yearly visits for the local activity.
A default value is already filled in based on RetailSonar knowledge. In most cases, you can keep this value.
Click Apply to add the local activity to your simulation.
When should you change this value?
Only change the destination visitors if you have reliable information about the expected number of visits.
For example:
- Increase the value if the location is expected to be a strong local attraction with above-average visits.
- Decrease the value if the location is expected to be less visible, weaker, or less attractive than similar activities.
Step 5: Display the local activity on the map.
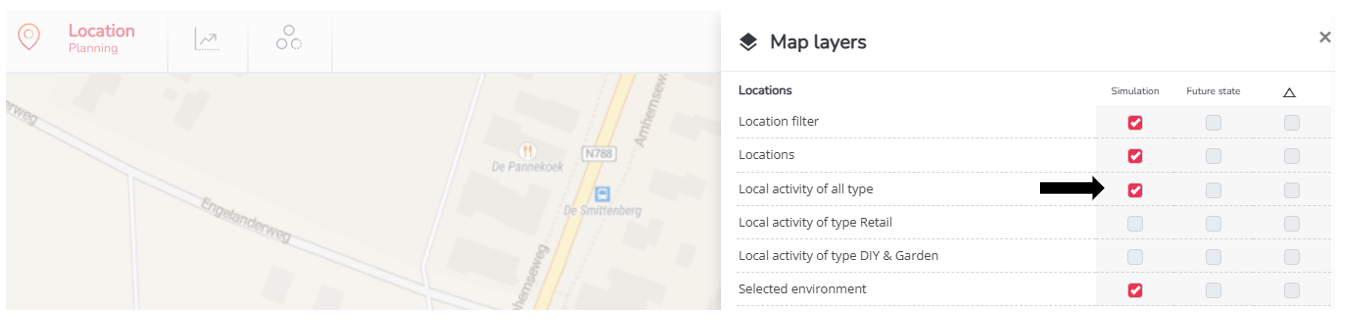
After adding the local activity, activate the corresponding local activity type map layer. This is important because the local activity has been added to the simulation, but it will only be visible on the map if the relevant map layer is active.
Once the layer is active, the new local activity appears on the map and is marked in green.
Step 6: Check the simulation changes.
After adding the local activity, check the grey bar below the map. You should see that the count next to Local activity has increased by one.
Click the Local activity button below the grey bar to open the simulation changes overview. The new local activity should appear as an added location.

Step 7: Check which own and competitor locations are affected
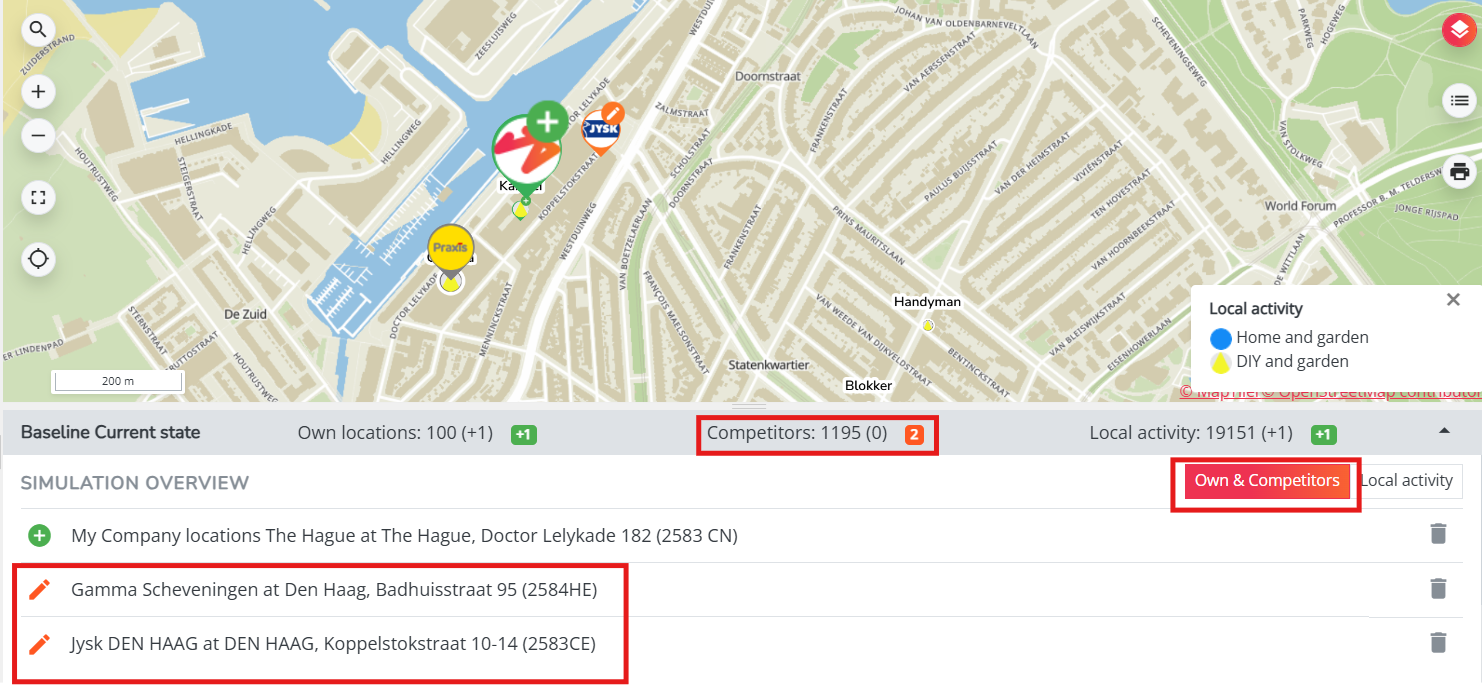
Adding a local activity can change the cross visit potential of nearby own and competitor locations. When this happens, these locations are shown as updated locations in the simulation.
You can recognize affected own and competitor locations in three places:
Where to check | What you will see |
Map | Affected own and competitor locations are marked in orange. |
Grey bar below the map | The count next to Own locations and/or Competitors increases. |
Own & Competitors overview | Affected locations appear as updated locations. |
Step 8: Review the updated cross visits.
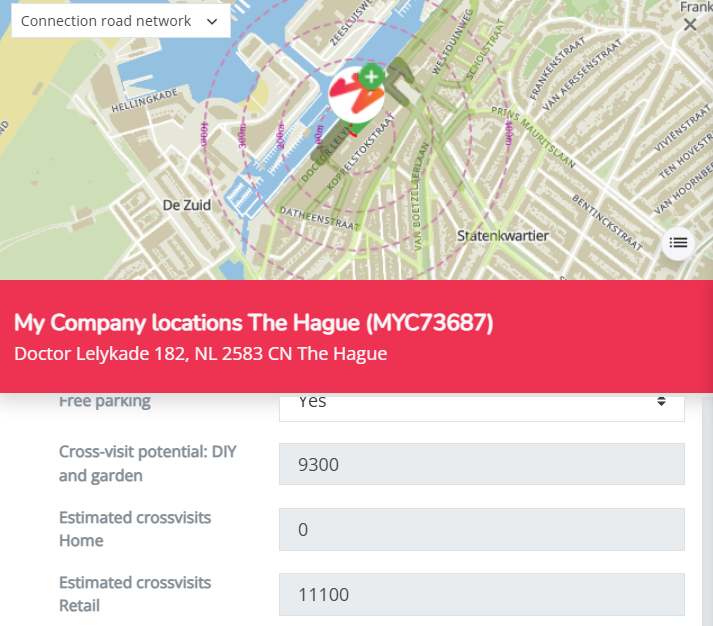
Open the pop-up of an affected own or competitor location. The estimated cross visits are updated for the relevant local activity type.
This shows how the added local activity influences the cross visit potential of nearby locations.
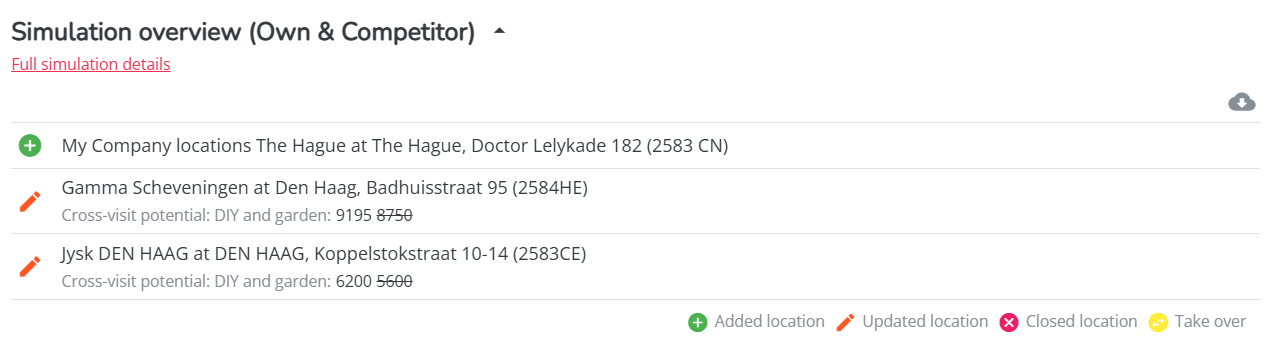
Step 9: Open the Location View Report of an updated or new own location. The report now contains two simulation overview sections.
Simulation overview: Own & Competitor.This section shows own and competitor locations that were updated by the simulation.
Simulation overview: Local activity. This section shows local activity that was added in the simulation.

Step 10: Review the micro-environment overview in the report.
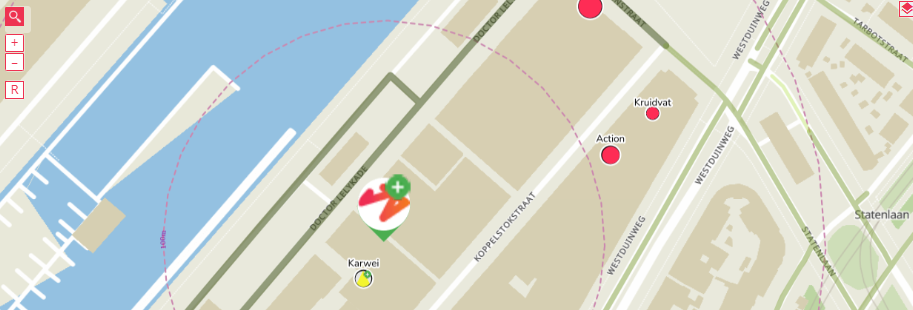
In the Location View Report, go to the Micro-environment overview. The added local activity is included in this overview. You will see it in the following places:
Section | What changes |
Location DNA overview | The estimated cross visits for the relevant local activity type are updated. |
Map | The added local activity is shown on the map. |
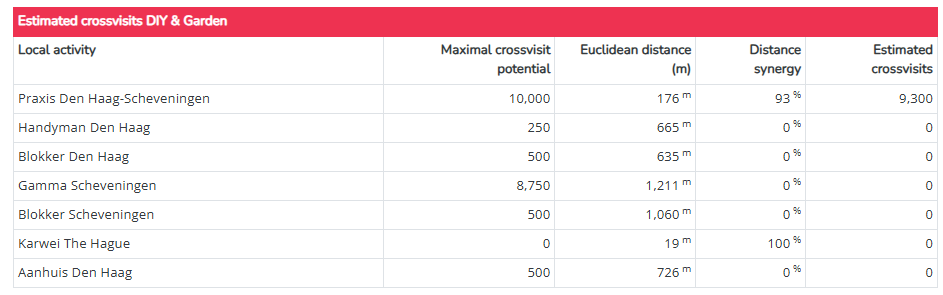
Cross visit potential table | The local activity is added under the relevant local activity type. |

Good to know
Simulating multiple new activities
If you want to simulate a future site with multiple new activities, add each relevant activity separately by local activity type.
This is recommended for future developments such as a new retail center, shopping park, or mixed-use destination.
Adding each activity separately helps the simulation better reflect the expected composition of the site and the impact of each local activity type.
Simulating a local acitvity closure
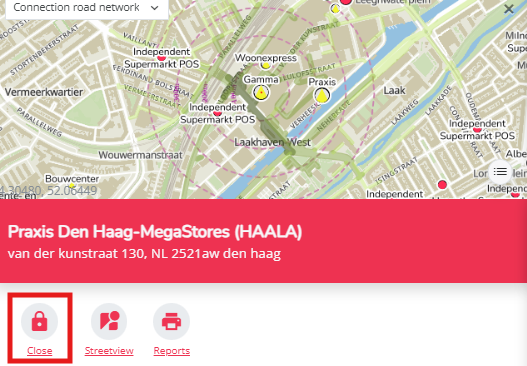
You can use the same steps to simulate a closed local activity.
In that case, select the local acitvity marker on the map and indicate 'close' in the location pop-up. The effect works in reverse: the cross visit potential of nearby locations may decrease.
Model sensitivity
The predicted results of own and competitor locations only change if the added local activity type is sensitive in the predictive model.
Check your consultancy slides to see which local activity types are sensitive in your model.
Simulation overview when loading a simulation
When you load a simulation into another module, the simulation overview window does not show local activity edits directly.
This overview only shows changes related to the own and competitor network.
This means that a simulation with an added local activity may look as if it only contains updates to own or competitor locations. These updates represent the impact of the added local activity on the network.