
Creating and interpreting the location performance report
This report is an essential tool for effectively managing your location's performance. It allows you to compare your real sales result to the predictive benchmark based on the performance of your network or a location cluster (if configured on your platform), identify your location's strengths and weaknesses, and uncover commercial and marketing optimization opportunities. This article guides you through the report to help you understand each section.
Understanding and leveraging your Performance report
Your performance report is more than just a table of figures: it’s a tool designed to help you manage your locations' performance. This document provides a detailed analysis of your current location by comparing it to a benchmark (an estimate of the potential turnover your location could generate according to your platform's model).
It will guide you through questions such as:
- How does my location compare to the benchmark?
- What are the key performance indicators of my location?
- What are the different market size drivers, and how does my location compare?
- What are the local marketing opportunities?
Contents of the Performance report
Summary
This section provides a snapshot of the key information found throughout the report. The summary focuses on the most important data:
- The real sales generated by your location
- The predictive sales : the estimate provided by your platform's model for your location
- The customer profile around your location (wealth index)
- The different passage around your location: car passage or footfall (if configured)
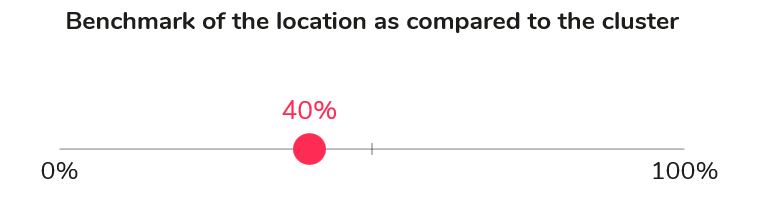
Location performance compared to the benchmark
With both real and predictive sales, your location can be classified in comparison to the rest of your network (or a cluster, if configured). It may be categorized as outperformer, normal performer, underperformer, or unprofitable with/without growth potential, based on how it measures up to the predictive model.
This comparison is then illustrated using the benchmark.
In this section, you’ll also find a table allowing you to compare your location to the entire network/cluster across several criteria:
- Penetration
- Average basket
- Frequency
- Predicted market share in the primary catchment area
To explore this further, depending on the results obtained, you can access the Location Performance module, which provides more context and insights into the levers you can activate to help your location reach its predictive potential.
- Customer behavior: this part shows the origin and profile of your customers, such as the wealth level around your location.
Key performance indicators of the location
This section highlights the determining factors for your location's performance.
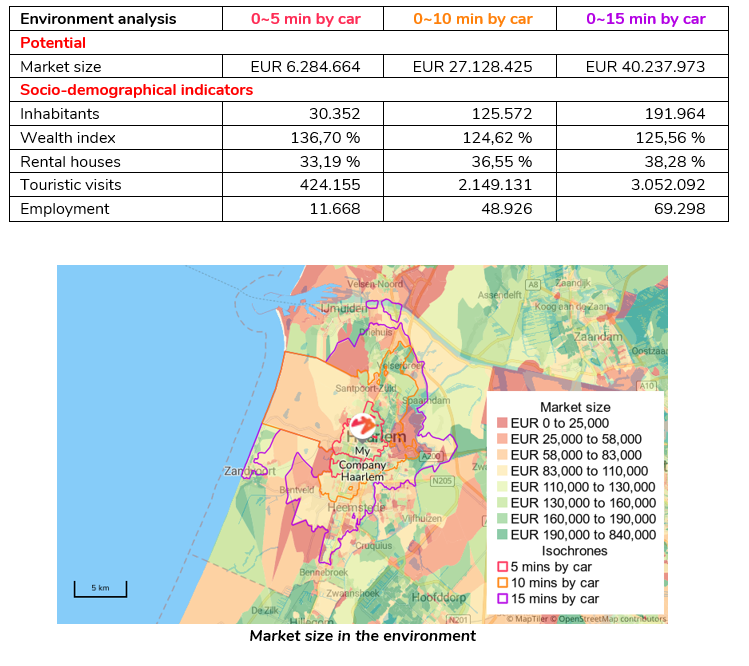
- Market size potential: this section summarizes the market composition and its size around your location.
A table and map detail the market size and components by catchment area (primary, secondary, and tertiary) surrounding your location.
- Potential based on passage (if configured): car passage and/or footfall passage. You’ll find an estimate of these flows, how they compare with the rest of your network or location cluster, a map showing the selected flows, and a distribution graph by day of the week.
- Potential from local activities: what nearby businesses are there near your location that can bring you cross-visits?
This section includes a map and tables listing local activities near your location, ranked by importance and type. The closer and more beneficial the cross-visits, the higher they’ll rank in the table.

- Competitive pressure around your location: all competitors within a 15 km radius are listed here.
- Location characteristics: every available criterion that impacts the model (positively or negatively) will be listed here. You’ll find aspects such as visibility, micro-accessibility, parking availability, location size, and other platform-specific criteria (if configured).
Local Marketing opportunities
This final section shows the areas where your marketing efforts should be concentrated, based on the predicted sales for your location for each zone. The greener the zones, the higher your predicted sales and the more focus you should put on marketing efforts.
You will also find a table listing all zones within a 10 minute radius of your location and their main characteristics, not by catchment areas, but zone by zone: population, wealth index, market size, predicted sales, and predicted market share.
