Comparing two data periods or simulations
In Marketing Efforts, you are able to compare 2 data periods; these data periods could either be baseline periods or simulations. The advantage of the compare to - mode is to analyze the evolution for the different KPIs in the data overview and to investigate the geographical changes on the map (and take appropriate action if needed)
Use cases
In general, the use cases for this could be:
- Comparing 2 baseline periods - analyzing the periodical evolution in KPIs
- Comparing a simulation with its baseline period - analyzing the impact of the network changes with the AS IS situation
- Comparing optimal simulations (that share the same baseline period) - analyzing 2 optimal network simulations and the impact on KPIs and zones
How to enable & read results
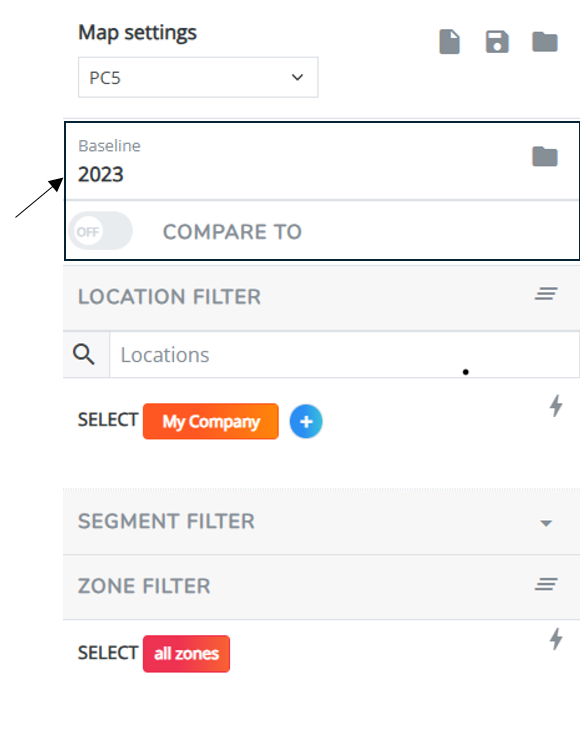
1. First, select the first data period by clicking the folder (
2. Next, click on the the enable 

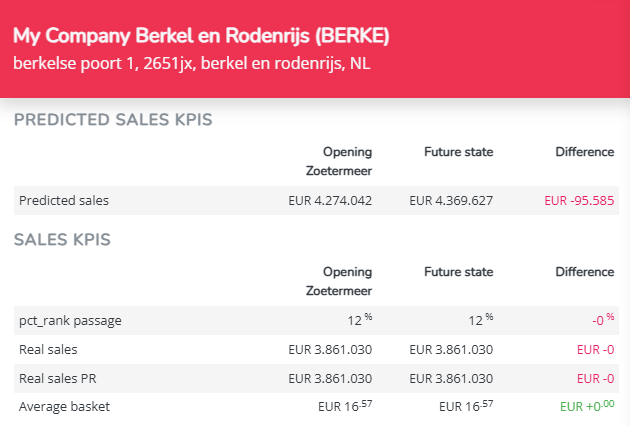
3. When you compare periods, the KPIs in the data overview below the map will be calculated for both periods, as well as the difference between those two periods.
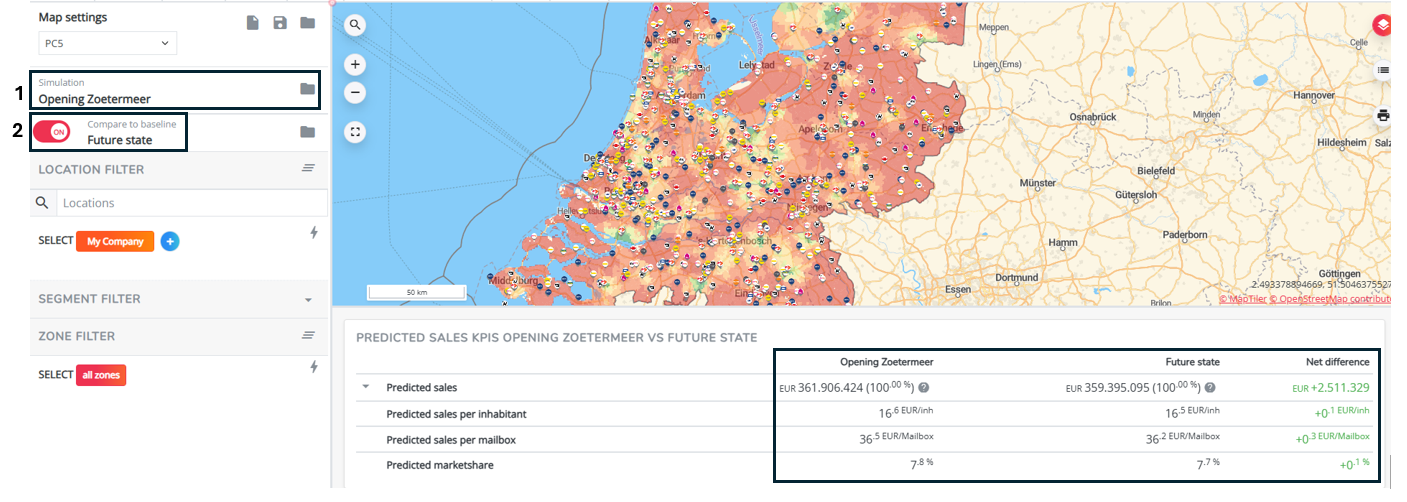
Remark: Note that the difference is always calculated by subtracting the first data period (1) from the enabled compare to data period (2).
4. The same will go for the map layers. You have the option to show a map layer for the first selected data period (or simulation), for the 'compare to' data period (or simulation), as well as for the difference between both.
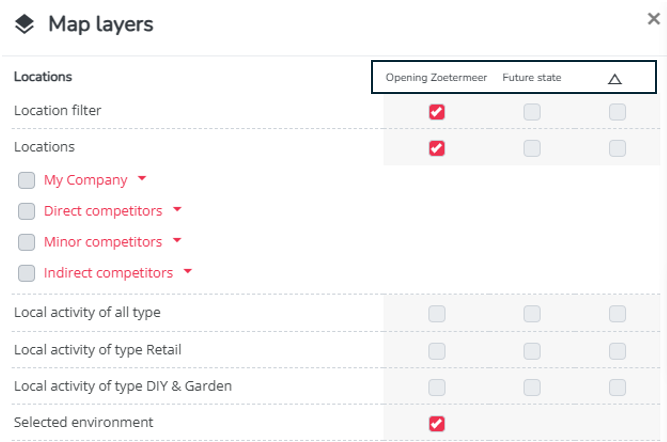
By default the standard checkboxes will be enabled for the first data period/simulation selection. For most map layers, indicated with a round checkbox (
), you can enable only one KPI at the time, for one of the data periods or the difference.
What is also different on the map, when you compare it to analyzing one data period, is the fact that both location and zone pop-ups contain now the information for both data periods (or simulations) plus the difference between the two (same as in your data overview below the map)
> If you click on a location logo on the map to open the location pop-up, you'll see the location information when you scroll down below the filter options:
Note that when there is no difference between the KPIs in for the 2 periods, the difference will mention '-'. When a location did not exist in one of the periods, the KPI number will be noted as N/A.
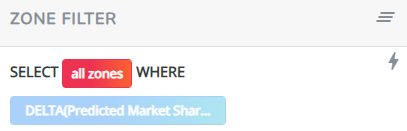
> If you click on a zone on the map to open the zone pop-up (make sure you selected the preferred geographical zone level in the module settings), you'll see the zone information when you scroll down below the filter options. Also the zone report will now contain the KPI information & difference for both periods. What is especially interesting* is to note the predicted market share graph that now shows the evolution:
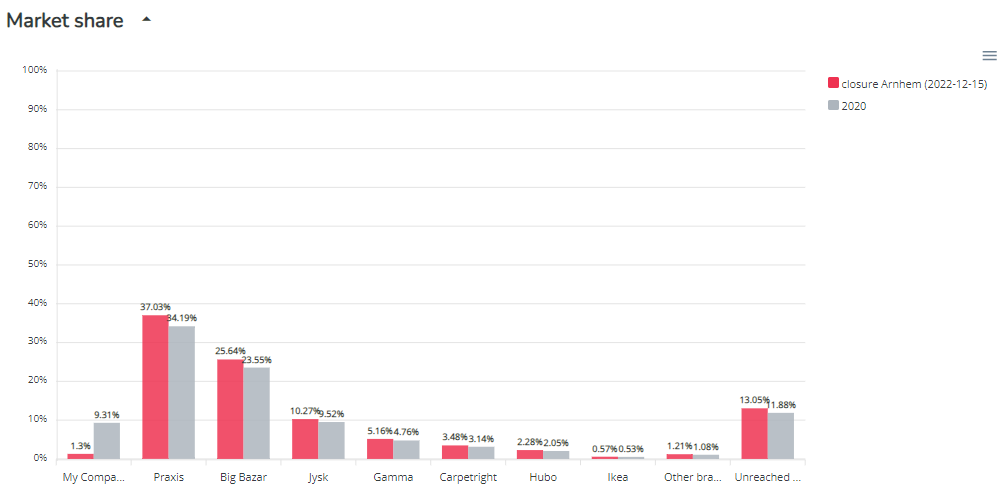
*depending on the use case.
5. Your exports to excel (launched by the download button 
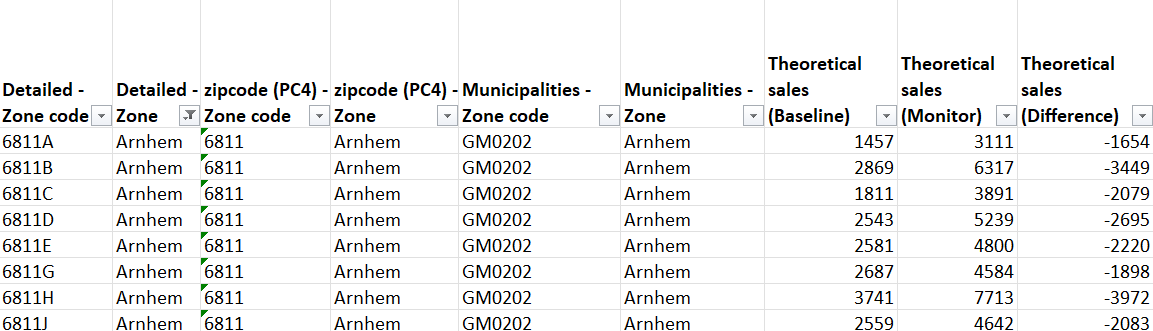

Tips & tricks
- When comparing a simulation (TO BE) with its baseline period (AS IS), first select the simulation through your period selection. Next click 'enable compare to' and select the baseline period upon which the simulation is built (also only possibility)
- use the predicted map layer(s) to analyze the differences on the map
- load the 'retention campaign view' to be able to filter (& export) on zones where there is a difference noted in predicted market shares'. When doing so, make sure you apply the right compare 2 data periods/simulations. (This view will automatically load your latest created closure simulation). This views contains a zone filter that you cannot create yourself!
- This compare to mode in Marketing Efforts is mainly targeted to analyze & monitor evolutions in KPIs, NOT to analyze the predictive model results for different simulations. (Cannibalization dynamics & network impacts can only be analyzed in the location planning module)