
Optimize project type: Hotspot exercise
A Hotspot exercise allows you to calculate the predicted potential of many candidate locations in batch.
Use this project type when you want to evaluate new openings, brand takeovers, or competitor locations without manually creating and calculating each location one by one in the Location Planning module. A Hotspot exercise is especially useful when you want to compare a large number of locations under the same conditions.
The Hotspot project uses the model configured for your platform. This is the same model that is used in the Location Planning module.
How a Hotspot exercise calculates locations
In a Hotspot exercise, each uploaded location is tested individually against the selected baseline network.
The calculation follows this logic:
- A candidate location is added to the selected baseline network.
- The model calculates the expected performance of that location.
- The location is removed from the network.
- The next candidate location is added and calculated in the same way.
This means that locations are calculated one by one. The project does not calculate the combined effect of opening multiple candidate locations at the same time.
This avoids combination effects between uploaded locations and allows you to compare all candidates under consistent conditions.
Starting point of the calculation
a Hotspot exercise can start from different types of input:
- Own uploaded locations: you'll upload your own list of candidate hotspot locations.
- Predefined inspiration sets: you'll choose one of RetailSonar's predefined datasets to test hotspot locations: this can be a ready-to-use inspiration set (mix of different retail brands) or a specific brand location list.
- Brand take-over: As part of a brand take-over strategy, you'll test the locations of a competitor brand to define your hotspots.
You can base the calculations either on a chosen baseline period or a saved simulation.
What you get after calculation
After the calculation, the results are shown in a summary table. This table contains the key indicators from your model, such as predicted potential, expected impact on your network, and potential cannibalization.
The calculated locations are also displayed on the map. A color gradient helps you quickly identify locations with higher or lower predicted potential.
These results help you compare many candidate locations and select the most relevant ones for further analysis.
How it works
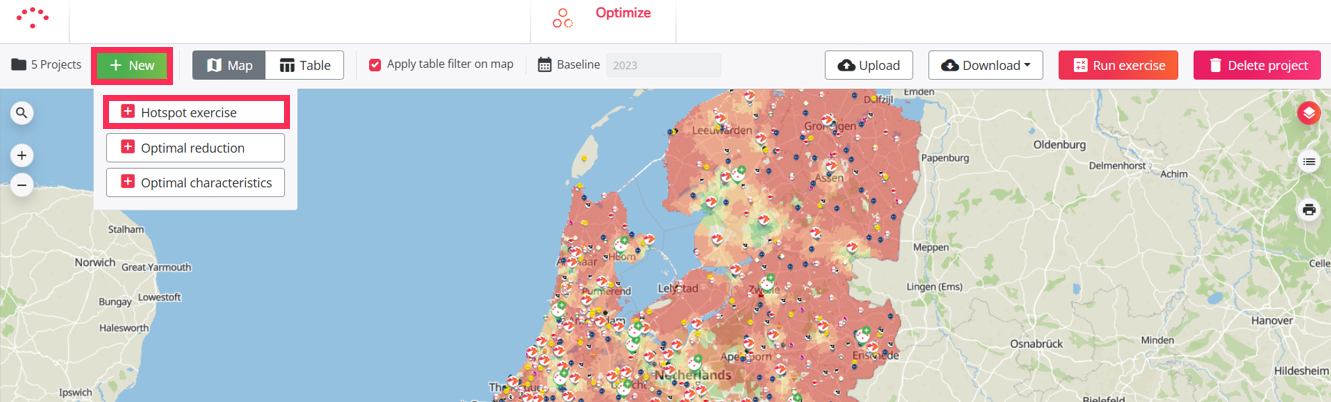
To start a Hotspot exercise project, you have to follow the steps below:
- Create a project - choose hotspot exercise
- Select a period
- Choose a dataset
- Prepare your list of locations, if applicable
- Upload the template, if applicable
- Calculate the project
- Results interpretation guide after calculation
- Analyze and select relevant locations for further analyses
- Export results
- How to create a simulation based on your project (optionally)
- How to update your list of locations after calculation (optionally)
Further analysis in Location Planning (step 10)
A Hotspot exercise calculates each location individually. If you want to evaluate the combined impact of several selected locations, you can create a simulation from your Hotspot project and open those locations together in the Location Planning module.
This allows you to analyze the total impact on your network after selecting the most promising locations.