
Optimize project type: Optimal reduction
An Optimal reduction project allows you to calculate in batch the expected impact of closing existing locations.
Use this project type when you want to evaluate which locations could potentially be closed with the lowest negative impact on your network. Instead of manually creating and calculating each closure one by one in the Location Planning module, the Optimal reduction project tests multiple closure scenarios automatically.
The Optimal reduction project uses the model configured for your platform. This is the same model that is used in the Location Planning module.
How an Optimal reduction project calculates locations
In an Optimal reduction project, each selected location is tested individually against the selected baseline network.
The calculation follows this logic:
- An existing location is removed from the selected baseline network.
- The model calculates the expected impact of closing that location.
- The location is added back to the network.
- The next selected location is removed and calculated in the same way.
This means that locations are tested one by one. The project does not calculate the combined effect of closing multiple locations at the same time.
This avoids combination effects between closures and allows you to compare all selected locations under consistent conditions.
Starting point of the calculation
You can start an Optimal reduction project from:
- your current reference network;
- a saved simulation.
When you start from a saved simulation, the selected closures are tested against the network configuration from that simulation.
Selecting locations to test
In an Optimal reduction project, you do not need to upload a template. Instead, you select the existing locations you want to test as closures.
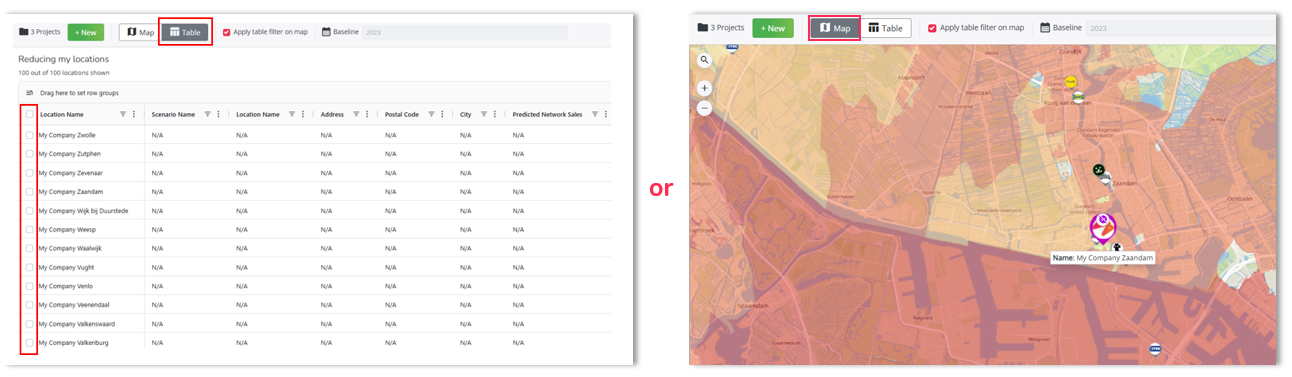
You can select locations in two ways:
- from the table, by clicking the checkbox in front of the location name;
- directly on the map, by clicking the location logo and then using the purple arrow to move to the next location.
Selecting locations from the table is usually the fastest method. Selecting locations on the map can be useful when you want a more visual approach, but it can take longer when many locations need to be selected.
What you get after calculation
After the calculation, the results are shown in a summary table. This table contains the key indicators from your model, such as recuperation, predicted sales impact, expected impact on surrounding locations, and impact on the overall network.
The calculated locations are also displayed on the map. A color gradient helps you quickly identify which closures have a lower or higher impact on your network.
Locations with a lower impact are less disruptive for the network. Locations with a higher impact are more critical and would have a stronger negative effect if closed.
These results help you compare many potential closures and select the most relevant ones for further analysis.
How it works
To start an Optimal Reduction project, you have to follow the steps below:
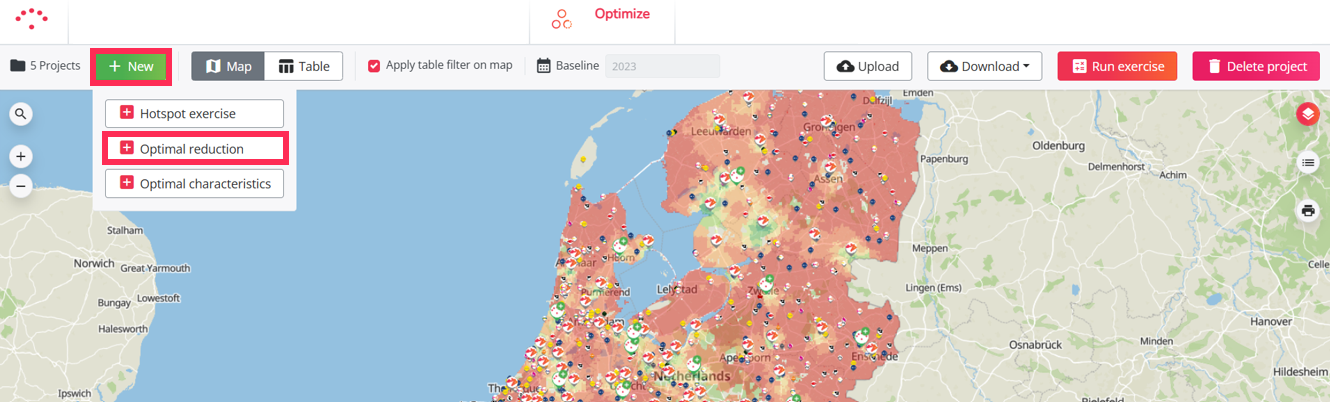
- Create a project - choose Optimal Reduction
- Select a period
- Switch to 'table view' and select the locations you wish to test as closures.
- Hit the 'test reduction' button
- Results interpretation guide after calculation
- Analyze and select relevant locations for further analyses
- Export results
- How to create a simulation based on your project (optional)
- How to update your list of locations after calculation (optional)
Further analysis in Location Planning (step 8)
An Optimal reduction project calculates each closure individually. If you want to evaluate the combined impact of closing several selected locations, you can create a simulation from your Optimal reduction project and close those locations together in the Location Planning module.
This allows you to analyze the total impact on your network after selecting the closures you want to investigate further.