
How to evaluate a location in an area that is still under development
Sometimes you want to test the potential of a location in an area that is still under development. As a result, households, competition, and local activity are not yet fully represented in the platform.
In such situations, the most accurate and data-driven approach is to apply a post-calculation, which will allow you to manually take into account the additional market size created by future developments.
Step 1: Create a simulation in Location Planning that includes the planned network change, such as opening a new store.
For detailed, step-by-step instructions on how to simulate a new location, consult this page.
At this stage, the simulation will not yet take into account additional market size from future developments.
Remark! If it is known or highly expected that a competitor will also open a location in the same area, this should be included in the simulation to ensure realistic results.
Step 2: After running the simulation, click on the zone where the residential development will take place. A pop-up window will appear, from which you can open the Zone Report.

Step 3: In the zone report, you will find various information about the zone. For this use case we are specifically interested in:
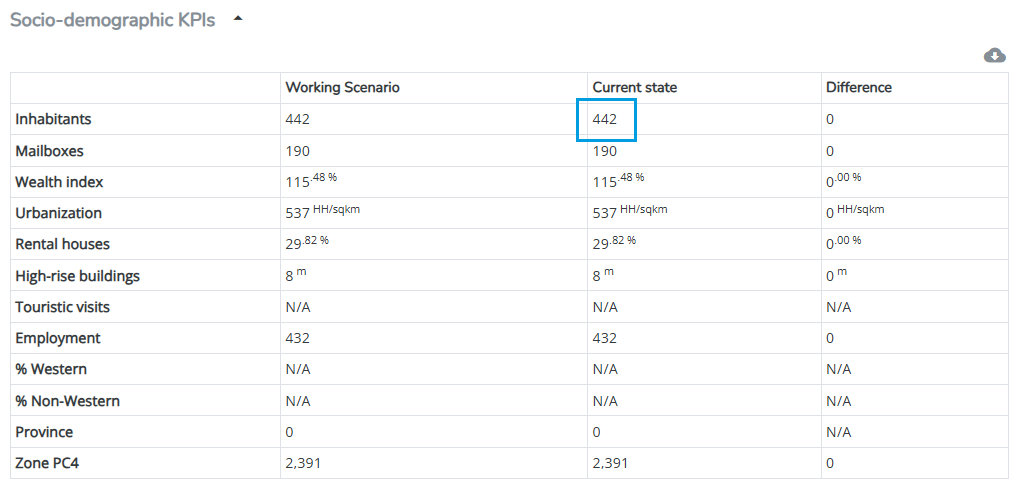
the Socio-demographic KPIs:
and the Market size KPIs:
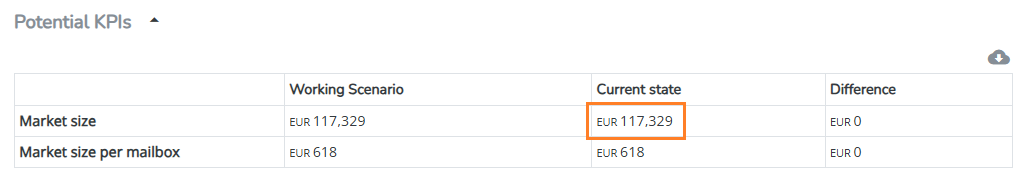
These tables show the current number of inhabitants or households and the current market size for the selected zone.
Step 4: In this step we will calculate the expected procentual growth of the population in this zone.
Before starting the calculation, it is important to verify whether the market size in your platform is based on households or inhabitants. Please consult the end presentation for this and apply the same unit consistently in the recalculation (either households or inhabitants)
Example (for a market size based on inhabitants)
Current population in the zone: 442 inhabitants
Expected additional inhabitants: 250 (Based on internal source, not delivered by RetailSonar)
Growth factor population = (442 + 250) / 442 = 1.52
This means the population is expected to increase by 52%.
Remark! No correction is applied for changes in the socio-demographic profile. If the future population profile significantly differs from the current profile, the actual market size may differ.
Step 5: Once we know the increase in the population in the zone, we are able to determine the market size increase as well.
As seen in the zone report, the current market size of the zone is €117 329.
Estimated market size after development = €117 329 * 1.52 = €178 340
This estimated market size after the development is €178 340.
Step 6: At the bottom of the Zone Report, you can find the predicted market shares for your location in this zone.
According to the simulation, the new location captures a 36.4% market share in this zone. By multiplying this share by the new market size, we have an estimate of the location’s predicted sales in the zone after development. By doing this we make the assumption that the market share of your location remains unchanged.
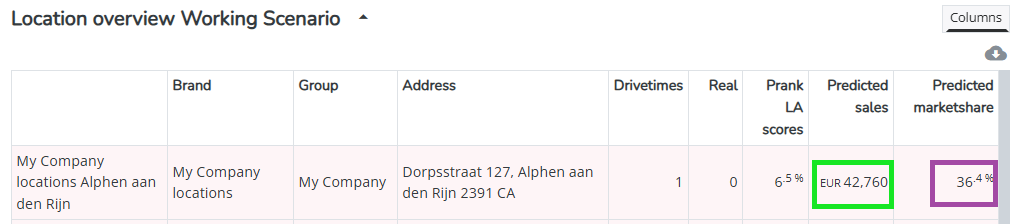
Estimated predicted sales after development = €178 340 * 36.4% = €64 916.
Previously, this zone contributed €42 760 (predicted sales of the zone), so the increase is: €64 916 - €42 760 = + €22 156.
Step 7: As calculated in the previous step, the total forecast for this location should increase by approximately €22 156. Add this amount to the result from your original Location Planning simulation.
Remark! This increase cannot be directly added within the platform and should therefore be applied in your own external calculations.
Hint: To keep the analysis complete, this adjustment can be documented in the case study report, alongside the original Location Planning results.