Examining location data
Location filter
By default, most platforms are set up from the own brand's perspective. This means that all location KPIs (visible in the data overview below the map) will refer to all locations in the own network for a given data period. However, it can be very relevant for certain users to only filter on a certain (subset of) locations. Eg.: you want to analyze a single location or perhaps you are a region manager and want to only analyze location from your regions only.)
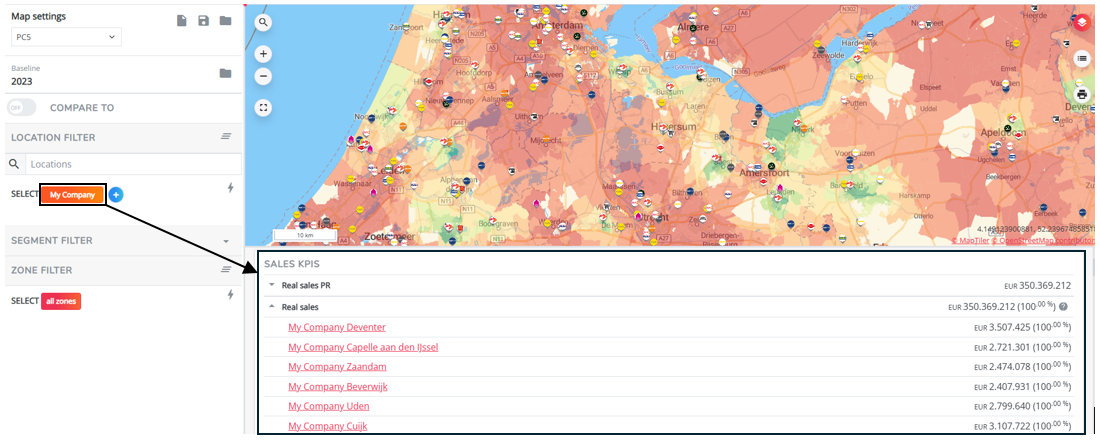
You can use the location filter in the left settings bar, to create and manage your own location filters. Making any changes up here will change the location perspective from which your KPIs in the data overview and map layers (if activated and corresponding to location data) are calculated.
1. Finding single location information
1A. Location pop-up
For single locations only, you don't really need (but you can, see below) to use the location filter to find all relevant information.
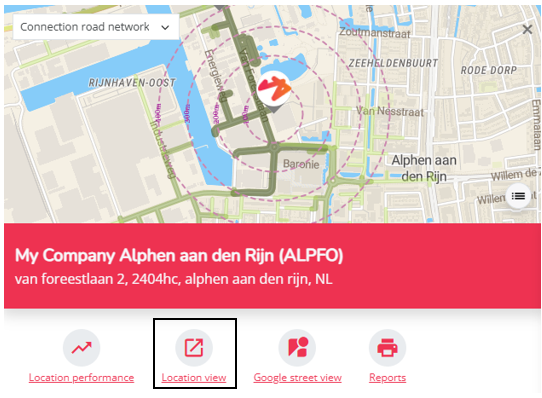
All location information can be accessed by clicking the location logo's on the map: a location pop-up will open subsequently displaying all known location data. Scroll down a bit until underneath the latest filter options to see the data overview. There is a distinction between the own locations' information and competitors locations' information.
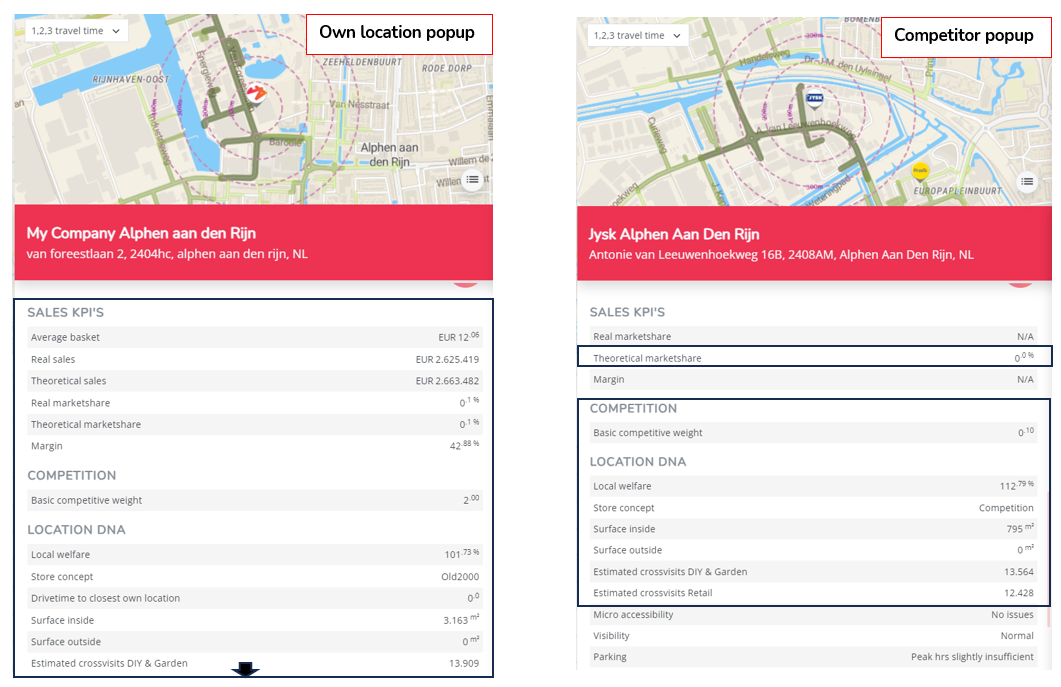
For the competitor information; most location characteristics are not known (except for surfaces & local activity scores) so the values you see there are neutral location characteristic values (not taken into account for the model results).
1B. Location reports
For the own locations; there is even a more extensive location report accessible if you scroll back up in the location pop-up and open the location view report; This report opens in a separate tab and displays all information from the micro and macro-environment.
2. Filtering on location data
2A. for your entire network
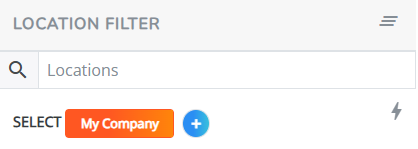
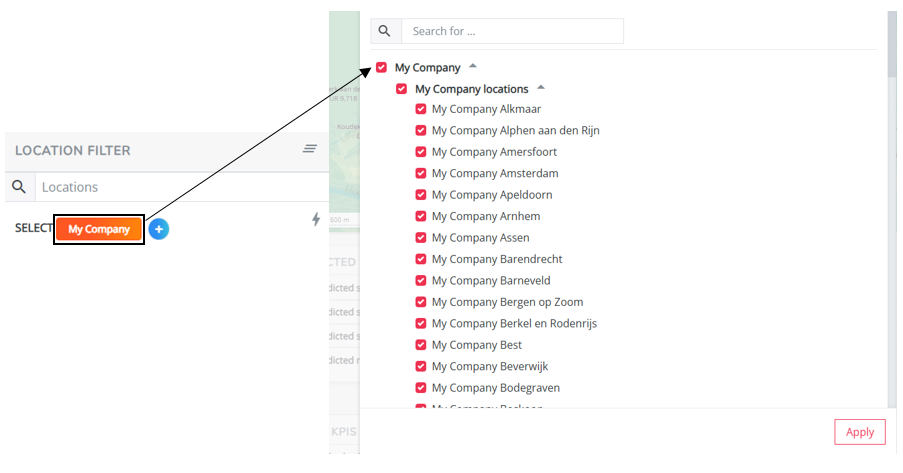
This is for most platforms the filter setting we configure by default (see also first image in this article). The default location filter has been set on all locations, from all own (sub-) brands within the overall brand group. The default location filter means also that when you would delete the changes (see last part of this article) you make to this filter, it goes back to filtering on the entire network.
You can also verify this by clicking the orange filter button; then you will see that all checkboxes of the own (sub)brands with all its locations are activated.
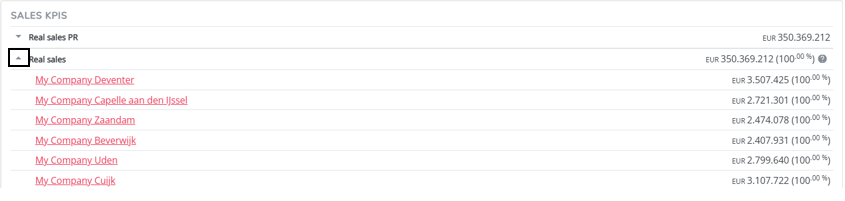
You can also verify this in the data overview underneath the map. The location KPIs display by default the network totals. But if you click on the deepdive button next to the location KPI 
2B. for a sub brand of your own brand
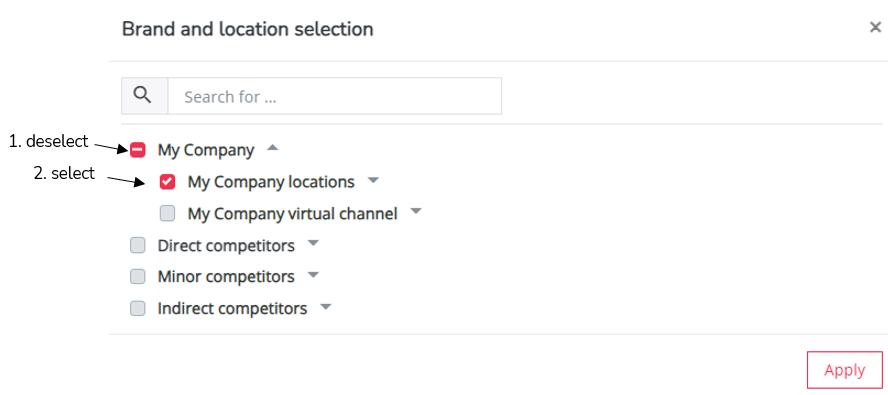
Click on the orange filter button, deselect the overall brand group and select only the preferred sub brand (if there are any)
On the map you will now see that the location logos corresponding to the selected brand group are magnified. If you have a map layer visualized that concerns location data (for example 'real' sales or 'real market share'), you will now only see zones coloured where customers live that have bought at any of the locations from the selected brand group.
In the data overview below the map you will now see for all location KPIs, the totals for the selected brand group only. If you click on the deepdive button next to the location KPIs you will only see the locations corresponding to the selected brand group.
2C. For one location only (own brand)
There are 3 ways to filter on 1 location;
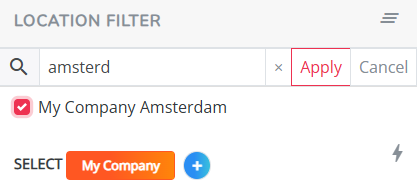
1.In the left settings bar, enter the name of the location in the location search bar & select the location when it appears. Then select apply.
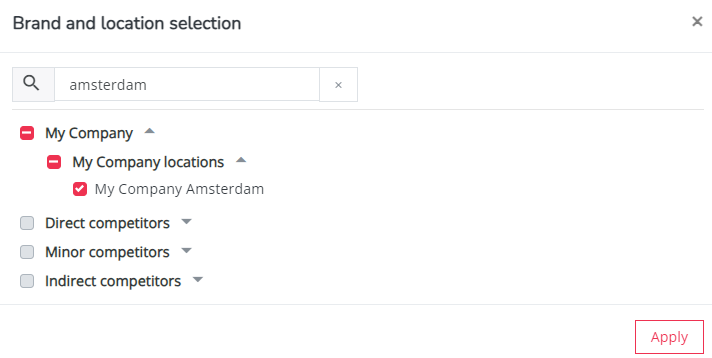
2. Click on the orange filter button, deselect the overall brand group and enter the location name in the search bar or look for it in the list. Select the checkbox and select apply.
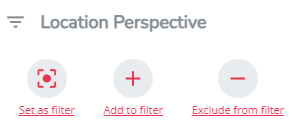
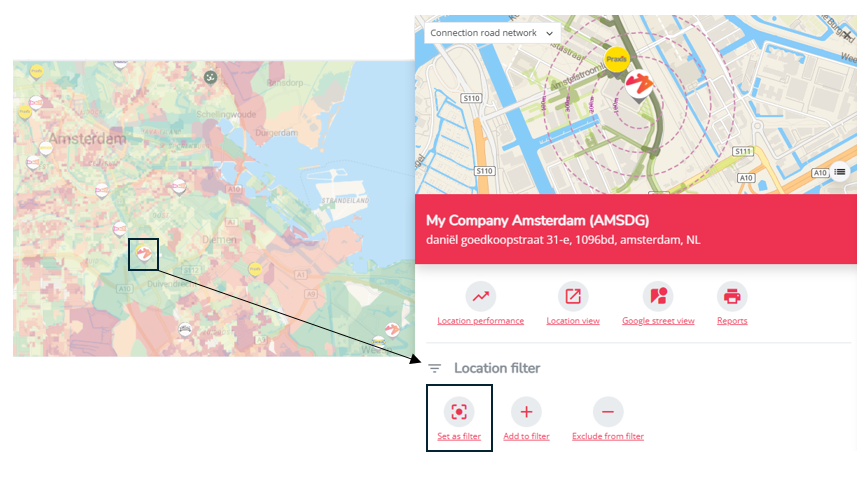
3. Look for the location logo on the map, click on the logo and select 'set as filter' in the location popup.
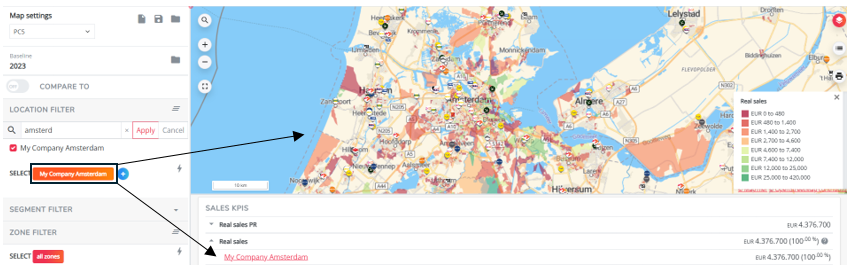
On the map you will now see the logo of this location magnified. If you have a map layer visualized that concerns location data (for example 'real' sales or 'real market share'), you will now only see zones coloured where customers live that have spend money in this location.
In the data overview below the map you will now see for all location KPIs, the total for this location only. If you click on the deepdive button next to the location KPIs you will now only see this location.
2D. For a specified set of own locations
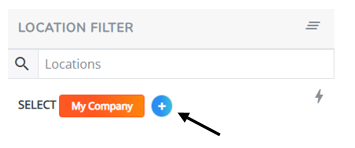
Next to the orange filter button, there is a blue 'plus' icon where you can add add conditional statements to the locations in your location filter (only for your own brand!). This implies that you filter the locations added to the location filter on certain characteristics. In order to do so, simply click on the blue plus icon and select the characteristic you wish to filter on.
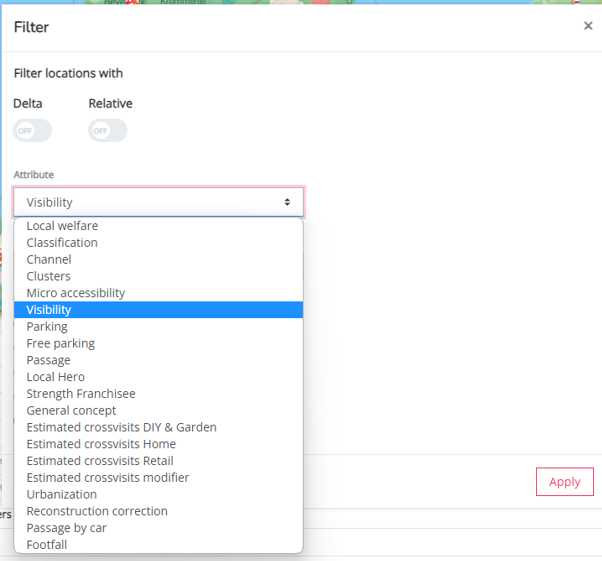
The list of characteristics and their values depend on which location characteristics are included for your platform.
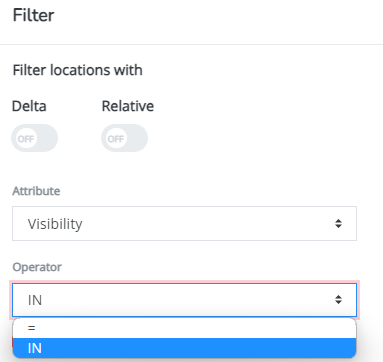
The operator checkbox will depend on the characteristic you have chosen: select "IN" to select multiple values, select "=" to select 1 value (also >, <, <=, >= are possible options)
You can, for example, filter the locations on good and best visibility (see example below). Note that the conditional filter on visibility will appear as a blue filter button in the location filter section. You can add additional filters - passage higher than 1000 in the example below - by clicking on the blue plus icon another time and by selecting another characteristic.
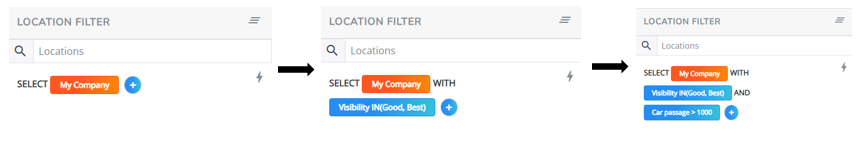
Be aware that if you add multiple conditional filters, this will only work like this (for the example above): from all locations in your network, you only want to see locations that have a 'best' and 'good' visibility; of those location you only want to see the locations with a passage > 1000. So the conditional filters work together from left to right.
On the map you will now see that the location logos corresponding to the selected location filter are magnified. If you have a map layer visualized that concerns location data (for example 'real' sales or 'real market share'), you will now only see zones coloured where customers live that have bought at any of the locations from the filter.
In the data overview below the map you will now see for all location KPIs, the totals for the those locations only. If you click on the deepdive button next to the location KPIs you will only see the corresponding locations.
2E. for competitor brands
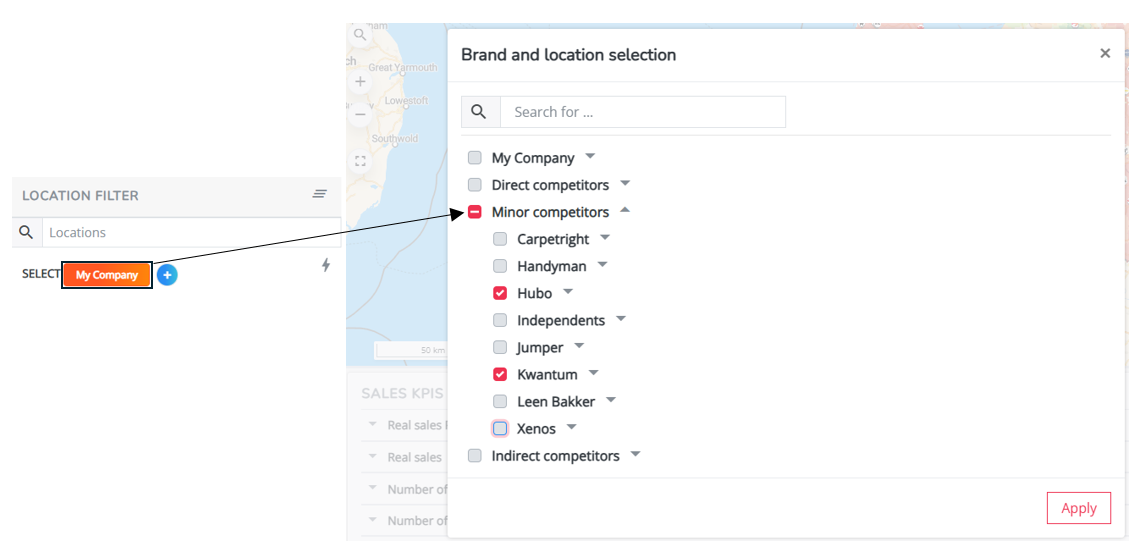
Click on the orange filter button, deselect the own brand group and select one of the overall competitor groups or click open the group and select the preferred competitor brand(s). Or use the search bar in the pop-up and type the name of a competitor; the brand will be immediately selected if found.
Select apply when your selection is final.
On the map you will now see that the competitor location logos corresponding to the selected location filter are magnified. Only predicted map layers will be visualized for competitor data (e.g. 'predicted market share'), since the model can only predict results for these brands (no real data is known)
In the data overview below the map you will now see for all predicted location KPIs, the totals for the the selected brand(s) only. If you click on the deepdive button next to the location KPIs you will only see the corresponding individual locations.
3. Saving & deleting (location) filters
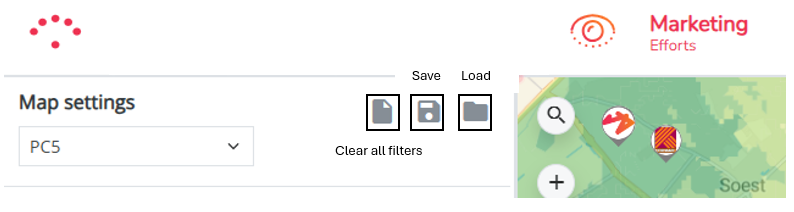
If you are using certain location filters a lot, aside from the default filter, you can always save them by clicking 'save' on top of the settings bar. Give your 'view' a name and click the 'load' button to retrieve it another time.
At any time, you can go back to your default location filter (=the brand we configured as the main perspective to analyze location data) by deleting the previous applied filters.
- Clear only the location filter
= reset to the default brand. - Clear all settings by cleaning your view
= reset to the default settings.

Remarks
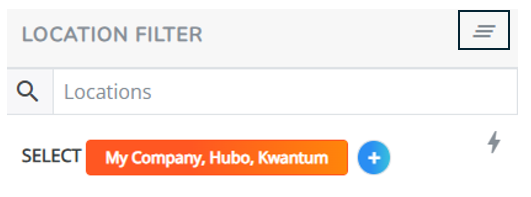
- Hovering with your cursor over an orange filter button will show you which locations, brands, brand groups, or zones are currently added to the filter.
- Note that you can also add or exclude single locations to the filter by using the functionalities in the locations pop-up when clicking on a location marker on the map and selecting 'add to filter ' or 'exclude from filter'