
Willingness to travel
The readiness to which customers are prepared to travel towards your (or competitor's) locations. We can identify 2 dynamics: planned buying (destination traffic) and impulse buying (non-destination traffic).
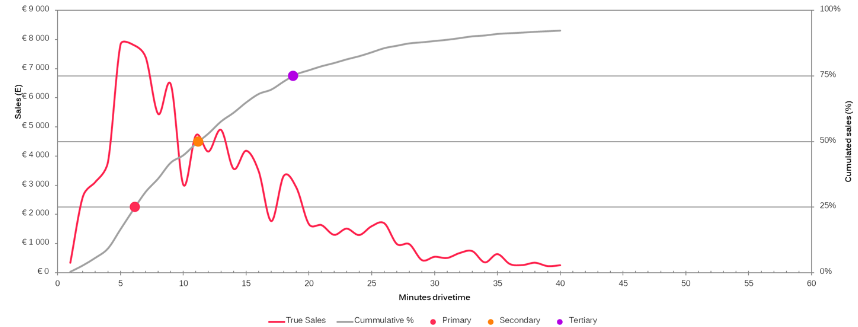
On the horizontal axis you see the minutes drivetime (or walk time, bike time) to your locations. The primary vertical axis shows the total sales. The true sales graph (in pink) represents the absolute sales reached by the network in relation to the minutes drivetime. The vertical axis and grey graph show the cumulated sales. In this example we see that:
- 25% of current sales are reached within 6 minutes drivetime = Primary catchment area
- 50% of current sales are reached within 12 minutes drivetime = Secondary catchment area
- 75% of current sales are reached within 19 minutes drivetime = Tertiary catchment area
PLANNED BUYING VS IMPULSE BUYING
- Planned buying (destination traffic):
- Rational purchases: people deliberately choose to come and buy goods in your location
- e.g. buying bread
- Impulse buying (non-destination traffic)
- Emotional purchases: people leave their house without having a clear idea what to buy , shopping behavior, accidental passer-by's, work-life traffic, ...
- e.g. go shopping for clothes"
Last updated: 3/28/23, 2:15 PM