Export options in Marketing Efforts
There are different ways to export the data from the platform. Please note that this article concerns only the exports from the Marketing Efforts module.
The different types of exports you can make here are
- Map & filter results (XLS)
- Map prints (PDF)
- Zone reports on all installed zone levels (PDF)
- & the tables from specific sections (xls)
- Standard location reports (PDF)
- & the tables from specific sections (xls)
- Not-standard location reports (Word Doc)
- Custom reports
- Location performance reports NEW!
1. Map & filter results (XLS)
To start exporting data to excel, always use the download button in the top menu bar:

Map & filter results to excel will always reflect the settings from the setting bar. There are different export types possible to match your chosen settings (e.g. zone/ location & segment filter).
You can choose to launch a custom report (select your own export type and KPIs) or use a preconfigured template by RS (export type is fixed, KPIs are already preselected but can be adjusted)
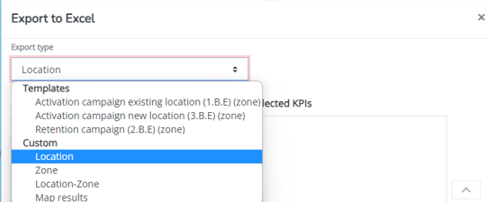
Choose the right export type
In general, there are 4 different types of exports to excel possible from the platform:
- LOCATION: for exports of location data, both for own locations and competitor brands, in scope for the map results of the applied location filter.
- Excel exports of type location contain a line per location (with location ID, name, address, and all selected KPIs)
- e.g. you want to know which competitors are within a driving distance of 10min from your own location ('How to export locations when a zone filter is applied?')
- e.g. you want to know the (predicted) sales of all own locations
- Excel exports of type location contain a line per location (with location ID, name, address, and all selected KPIs)
- ZONE: for exports of zone and location/zone data of all zones in scope for the map results of the applied filters.
- Excel exports of type zone contain a line per zone (with detailed/aggregated zone codes , zone names and all selected KPIs)
- e.g. you want to export the market size and other socio demographics within a certain environment or for all zones
- Excel exports of type zone contain a line per zone (with detailed/aggregated zone codes , zone names and all selected KPIs)
- LOCATION/ZONE: exports of the combination of location & zone data, both in scope for the map results of the applied filters.
- Excel exports of type location/zone contain a line per location (with location ID, name, address, the zone codes of the zone where there is location data retrieved for the location, for all selected KPIs) This can be used for real/predicted sales KPIs - where the link is made between the turnover of a location in a zone
- e.g. within a certain environment, you want to know for each zone the real/predicted sales for certain locations
- e.g. you want to export a location's customer area
- Excel exports of type location/zone contain a line per location (with location ID, name, address, the zone codes of the zone where there is location data retrieved for the location, for all selected KPIs) This can be used for real/predicted sales KPIs - where the link is made between the turnover of a location in a zone
- MAP RESULTS: export of the (re)calculated KPI results in the data overview below the map, corresponding to your applied filters.
- Excel exports of type map results contain only one line with values, per column (selected KPIs)
Consult also "General remarks on XLS exports" below to understand certain particularities about these exports.
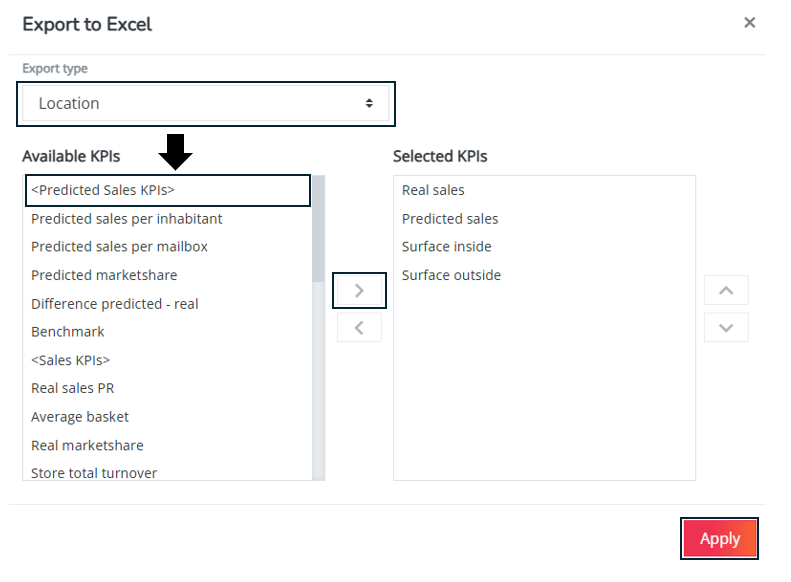
Select the data (KPIs) you want to export
First you need to select the right export type (in case you start a custom export); depending on this you'll see the list of available KPIs to export for that export type. (e.g. you can't export market size within a location report, since this is data related to zones, not to locations)
In case you've selected a preconfigured template for your export, the type of the export is already fixed and you'll see the list of available KPIs you can export.
From the list of available KPIs, select or deselect the KPIs you want to see in your XLS export by using the horizontally oriented arrows. Within the selected KPI list, you can still change the order of the selected KPIs by using the vertically oriented arrows (doing so means that first KPIs will appear in the first columns of KPIs in the export)
In case you started from an export template, you can still adjust the list of selected KPIs.
Remark on export templates: Most platforms contain 2 preconfigured export templates for Marketing purposes: 'Activation' and 'Retention'. Other possible export templates can be configured by our consultants in case you are often selecting the same export type and KPIs. Or let us know if you want to create your own export templates (you'll need a different user role for this)
Retrieve your export
Once the XLS export is ready, you are notified by mail and an in-app notification that the export is ready for download. > Click on the notification to open the download.
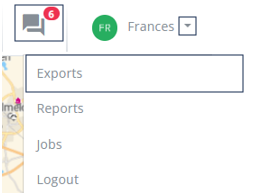
You can also retrieve the export up until 30 days after launching from your usermenu. Click on your username and the exports section in the usermenu to open the overview of launched exports of the last 30 days.
General remarks on XLS exports
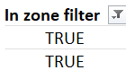
- The location export will always include all locations of the brands selected in the Location filter, regardless of the selected environment filters. However the export contains a column 'in zone filter': filter on TRUE to have the locations corresponding to your zone filter.
- If the export contains no data for the selected KPIs, the cells will be empty.
- The zone export and location/zone export on the other hand, will only include those zones or location-zone combinations that have a value for at least one of the selected KPIs.
- Zone and location/zone reports on the detailed level will automatically also contain the aggregated zone codes. This is not the case vice versa! so if you're exporting on the aggregated zone level the export will not contain the detailed zone codes.
2. Map prints (PDF)
You can export the map to PDF by pressing the print button (

3. Zone reports on all installed zone leves (PDF)
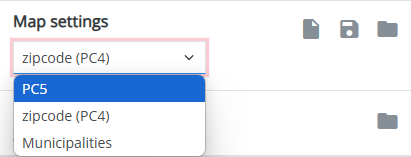
To export the zone reports on different geographical zone levels:
1. Make sure to first select the preferred geographical level
2. Click on the zone on the map to open the zone pop-up
3. Click zone report
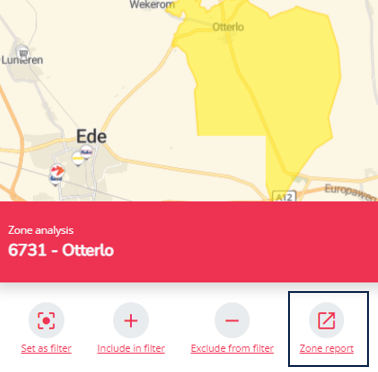
4. The report opens in another tab. In the report, click on your right mouse button, select PRINT and choose SAVE AS PDF
TIPS & BEST PRACTICES
- You can export the data within the tables separately to excel by pressing the export button (
) above the table
- In case you don't want certain sections in your PDF export, hide the sections by clicking
, then save the report again
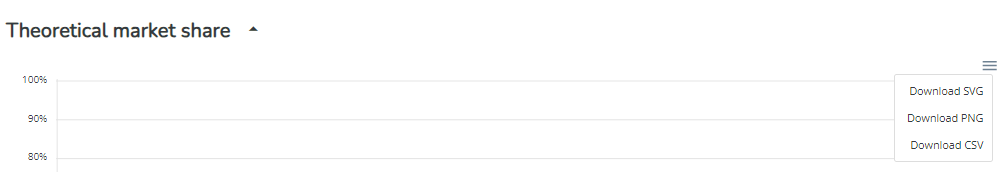
- You can download the predicted market share graph separately as a SVG, PNG or SVG format.
4. Standard location reports
All platforms contain standard location reports, for existing and new (simulated) locations of your own network. The layout and different sections in this report are fixed, but it is possible to add/remove certain KPIs in this report by the consultants (on request)
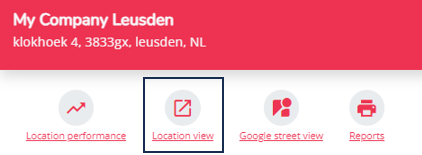
The location reports can be opened by clicking on the location logo's on the map (one by one). A location pop-up will appear where you can select the location view button (on top of the pop-up). For new (simulated) locations, make sure to first select the simulation in the period selection to find the new location logo -indicated with a green plus- on the map.
The location reports open in a separate tab. In the report, click on your right mouse button, select PRINT and choose SAVE AS PDF
Standard location reports are not saved automatically when generated (unlike custom location reports, read below)
TIPS & BEST PRACTICES
- You can export the data within the tables separately to excel by pressing the export button (
- In case you don't want certain sections in your PDF export, hide the sections by clicking
5. (not standard) Location reports (Doc)
Custom location reports
Custom location reports, for existing and new (simulated) locations, can be configured on request of the customer. Custom reports contain a custom personalized layout & branding and contains more extensive data explanations.
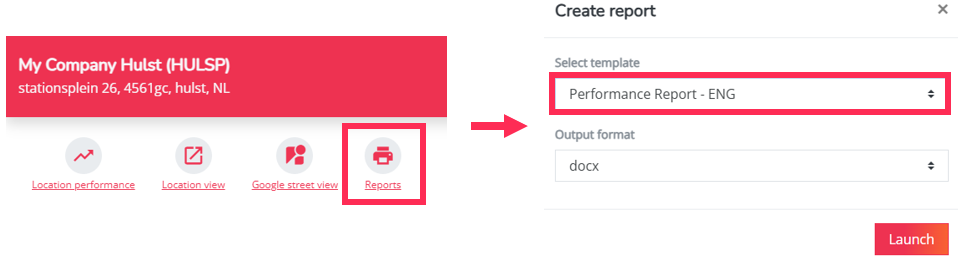
In case custom reports were configured you can start generating them by clicking on the location logo's on the map (one by one). A location pop-up will appear where you can select the reports button (on top of the pop-up). For new (simulated) locations, make sure to first select the simulation in the period selection to find the new location logo -indicated with a green plus- on the map.Then choose the Custom Report in the list and click on the Launch to start the creation of your custom report.

Location performance reports NEW!
Location performance reports (only to retrieve for existing locations) are configured for some of our customers. If you don't have access to them yet and are interested, please contact our support team.
This report is a practical and strategic new feature hat helps you better understand and evaluate your locations. It allows you to easily compare your results to a benchmark and identify the strengths and weaknesses, where there’s room for improvement, and which marketing or sales actions could boost your performance. You can find more information in this article.
To start generating the location performance report you have to click on the location logo's on the map (one by one) and in the location pop-up you can select the reports button (on top of the pop-up). Then choose the Performance Report in the list and click on the Launch to start the creation of your performance report.
Dowload your report from the reports section (user menu)
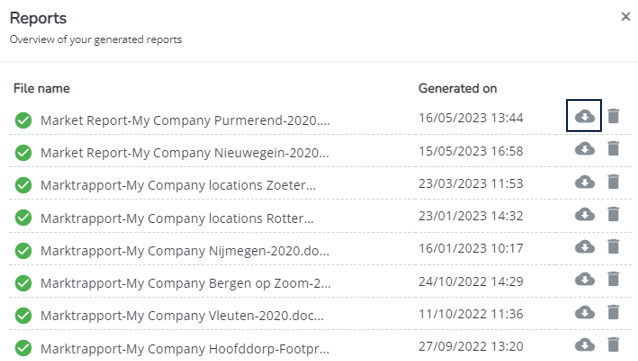
When the reports are ready for download, you can retrieve them from the user menu by clicking on the reports section.
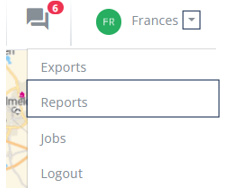
The generated reports will automatically be saved for 30 days on the platform, so you can always go back to the menu to open them again. Successful report generations will be indicated by a green icon. When they are not ready yet this icon 
Open them by clicking on the download button.