
How to test a new truck charging location
To test a new charging point for trucks, please follow these 4 main steps:
1. How to find inspiration to identify hotspots
2. Create the new charging point and validate its characteristics
3. Validate the environment around the new location
4. Download the report
Note! Unlike for car charging, we do not currently offer predictions in terms of kWh potential for truck charging. We provide key indicators to help you compare your site with others and assess the relative relevance of each locations. You will find these indicators at the end of your simulation in your report or in the optimize table*.
We recommend consulting our technical report here to learn more about the data we use, how we use it, and the different models we develop for trucks charging.
*This module is only accessible for power users only.
1. How to find inspiration to identify hotspots
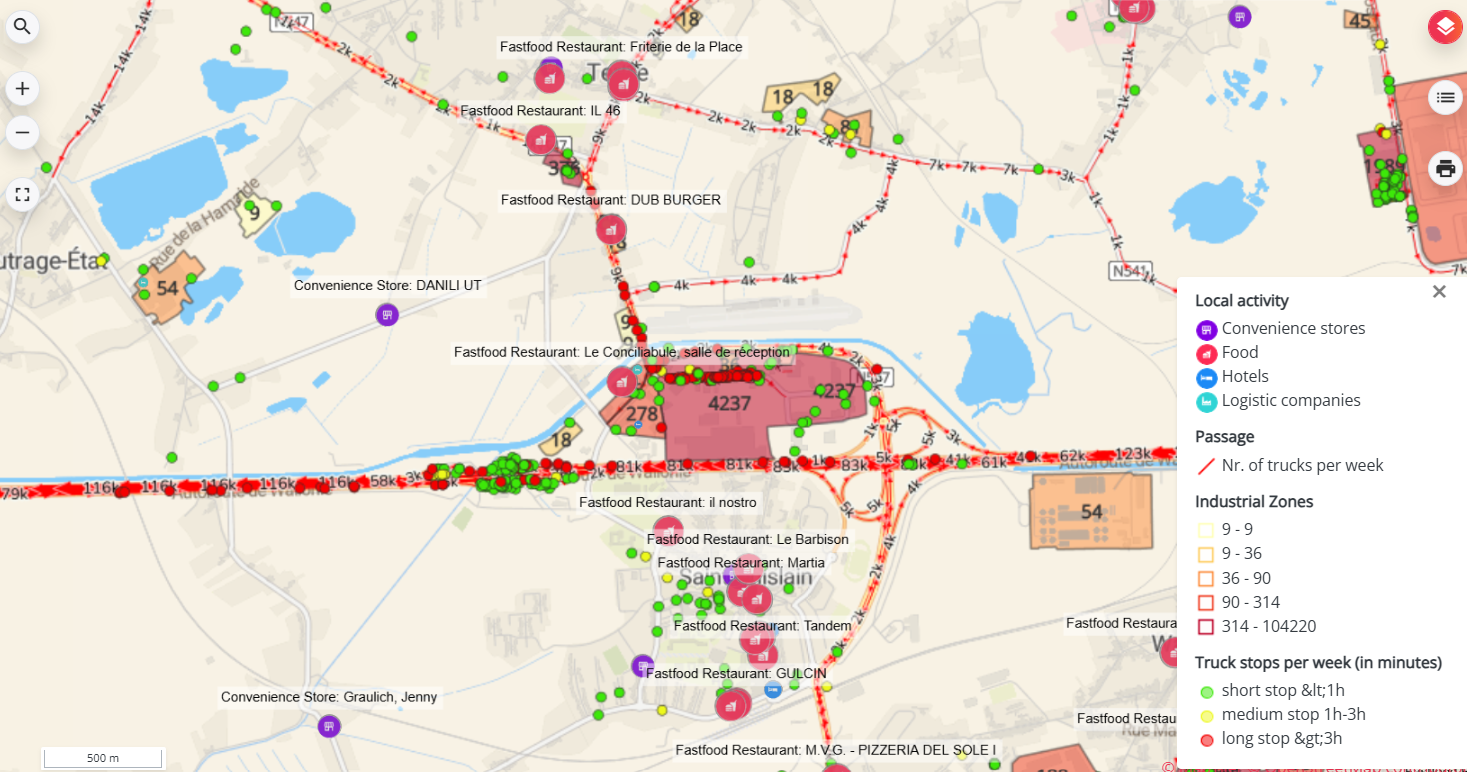
First, you need to explore the map data to find interesting potential search areas, you will need to explore the areas that are most promising and relevant to you. Here are some guidelines to help you find those.
- Access the Location Planning module.
- Click on the map layer button
(top right corner of the map) and select the following layers:

- Truck passage: This map layer displays the number of trucks passing by per week on each road segment.
- Relevant Local Activity:
- Logistic companies
- Hotels
- Convenience stores
- Food
- Custom map layers (cumulative)
- Electrical grid
- Different truck stops per week, categorized into three segments (short <1h, medium 1h-3h, long >3h).
- The number of truck stops in industrial zones (complementing truck stops data with zone-based information).
- Other relevant layers (displayed one by one)
- Trucks stops by zone (all types of stops)
- Only short stops by zone
- Only medium stops by zone
- Only long stops by zone
- Employees in zone
By exploring areas with high concentrations of relevant local activity, significant truck passage, or short-to-medium industrial zones durations (<1h and 1h-3h), you will be able to identify the most strategic locations for a new charging location. Areas with high competition tend to be less attractive.
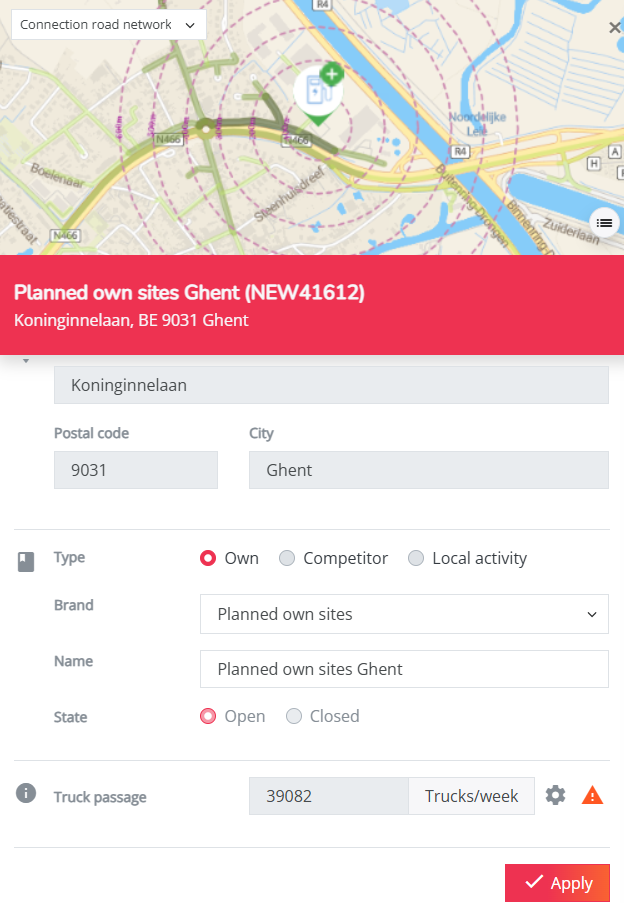
2. Creating a new charging point and validate its characteristics
You can follow all the steps described in the article for car charging locations.The characteristics you can specify for your trucks sites are simply fewer than for car charging.
For truck sites you need to verify the truck passage taken into account.
If you want to test multiple locations at once, you can refer to this collection of article about our Optimize module. It provides step-by-step guidance to help you prepare your locations, run the analysis, and interpret the results for a batch of locations.
Note that this module is only accessible for power users only.
3. Validate the environment around the new location
As for car charging, you need to verify the environnemnt auround the new location you want to test to be sure everything is taken into account, in terms of Local Activity and Competition, you can follow this article if one of them is missing in your simulation.
4. Download the report
Once you have validated your site and its characteristics, as well as its environment, you can download the report.
For each type of charging (Ultra-fast, fast and slow) you will find a score between 0% (lowest) and 100% (highest), which ranks the location in terms of its potential for the given type. The report also provides a summary of key indicators for all charging types analyzed:
For ultra-fast charging (>400kW):
- Number of truck passages in 3-minutes around the site.
- Number of short truck stops (<1 hour) and truck charging stations in 5, 10 and 20-minutes around the site.
- Details on nearby local activities relevant to ultra-fast charging.
For fast charging (150kWh - 400kW):
- Number of medium truck stops (1h-3h) in 5, 10 and 20-minutes around the site.
- Presence of logistic companies within 1km.
For slow charging (<150kW):
- Number of long truck stops (>3h) in 5, 10 and 20-minutes around the site.
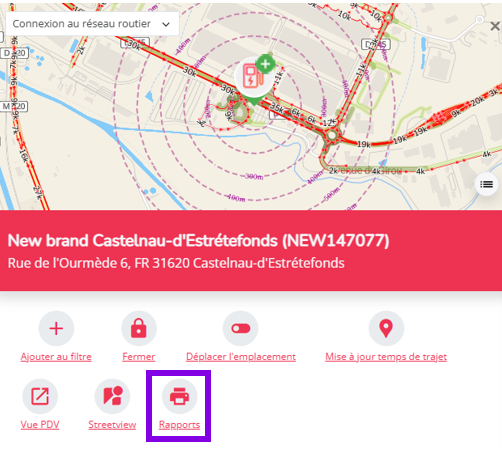
To download the report including these key indicators, click on the logo of the new location on the map, then on the Reports button. A pop-up window will appear, allowing you to select the desired output format/language.
When the report has been generated, you'll find it under your user name (top right) in the Reports section.
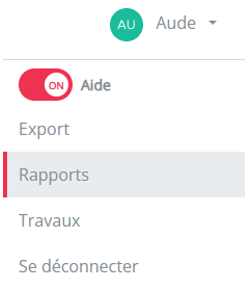
As soon the report has finished loading, a green icon indicates that it is finished. You can then download it by clicking on the 'Export' button.
If you are exporting a report for the first time, this section may not appear. To resolve this, refresh your browser page by clicking on the F5 key on your keyboard (alt + F5 keys on some computers), or on the refresh tool at the top left of your browser (
on Google Chrome and Mozilla Firefox).
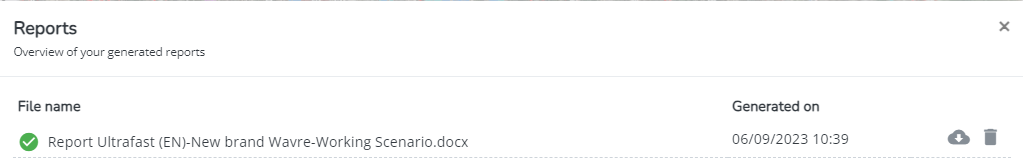
All reports will be saved here for an unlimited time.