How test in batch changes to the characteristics of my locations
Here, you have the option to create projects that will allow you to simulate and evaluate the impact of changes made to all or some of your locations. These optimization projects allow you to test different scenarios, adjusting parameters such as prices and power, for example.
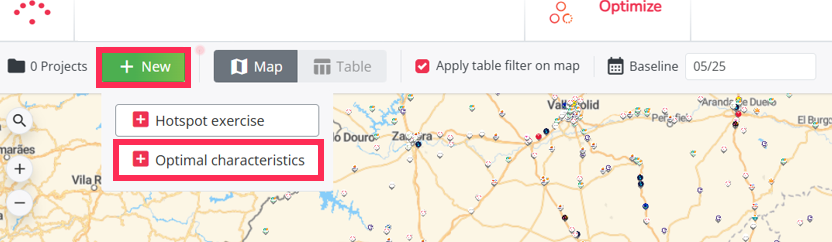
1. Create a new Optimal characteristics exercise
- Press the ‘New’ button and then ‘Optimal characteristics’
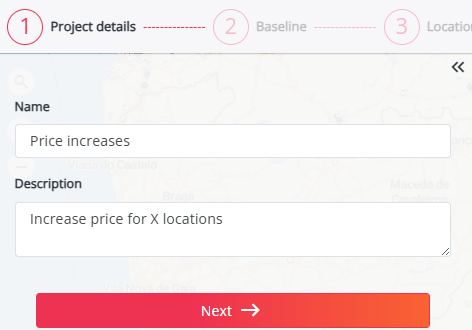
- Fill in the name of the project, enter a description (optional) and click on 'Next'
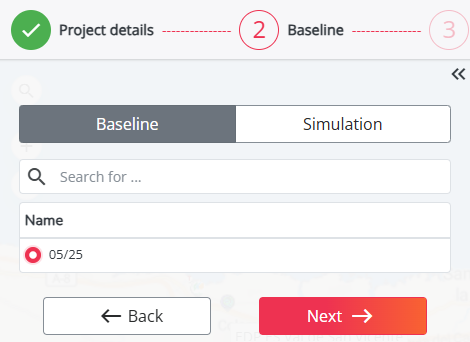
2. Choose your network
- Choose the baseline period or a simulation (the network on which you want to test the new locations) and click on 'Next'
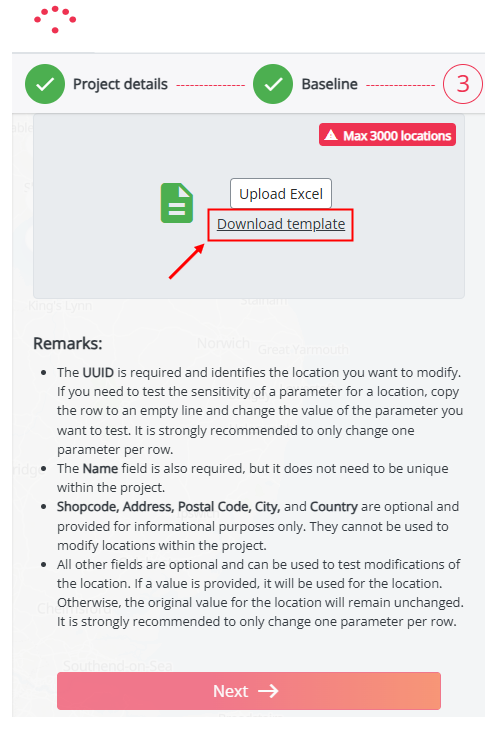
3. Download template to change the location characteristics
- Select 'Download template' to export all your locations to an Excel file.
- Edit the Excel file to modify the location characteristics you want to test. We recommend changing only one location characteristic at a time (per row) to accurately assess its impact. Changing multiple characteristics simultaneously will result in a combined effect, making it harder to isolate individual influences. For example, you can try testing an increase/decrease in the price for some locations.
4. Upload the Excel with updated characteristics
- Click on the 'Upload Excel' button and select the new file with the adapted location characteristics.
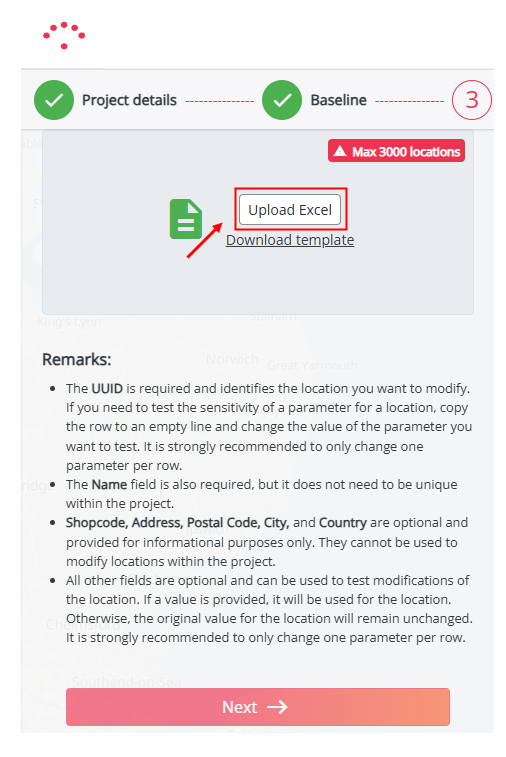
It might be possible that the validation of the file fails. You will see this when the job has a red explanation mark next to it. If you want to know how to solve this, please check out this article.
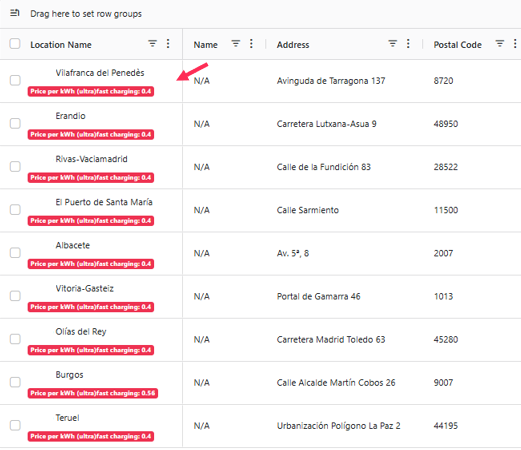
5. Calculate the exercise (after a successful import)
Once the Excel file is uploaded, sites concerned by this test can be viewed in two ways:
- In the table:
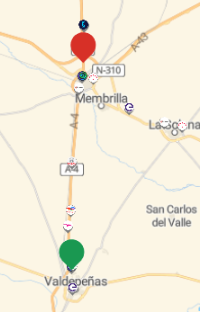
- On the map:
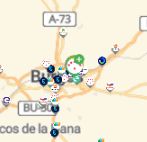
To calculate the theoretical potential of the locations, click on the button 'Run exercise' on the top right of the screen.

6. Validate your results
The Optimize module allows you to view the results on a map or in a table:
- The Map displays each site tested in a color, from red to green. Colors represent the positive or negative impact your changes may have on predicted kWh potential. Locations in red have had changes that have lowered theoretical potential, while locations in green have had changes that have increased theoretical potential.
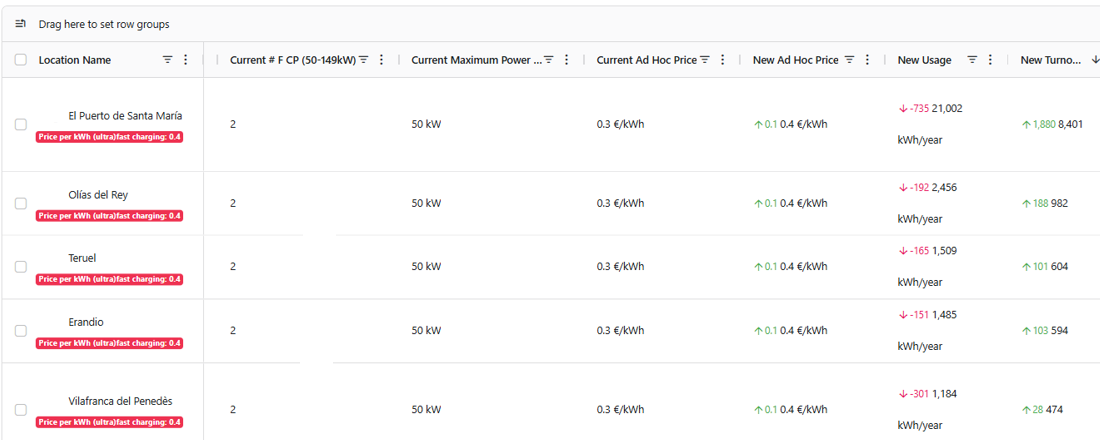
- The Table below shows the changes you made to your network. For each location, the current characteristics of your locations are displayed alongside the new imported parameters.
In the example below, we changed the price for some Fast charging location from 0.30€/kWh to 0.40€/kWh. This is reflected in the table by two separate columns: ‘Current Ad Hoc price’ and ‘New Ad Hoc price’. These adjustments give two additional columns: ‘New usage’ and ‘New turnover’, calculated from the characteristics you chose to change and the model parameters (car passage, local activity, etc.).
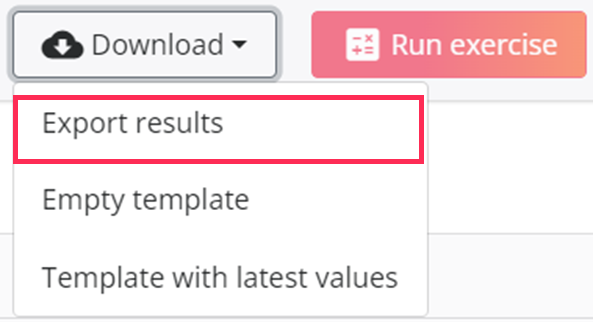
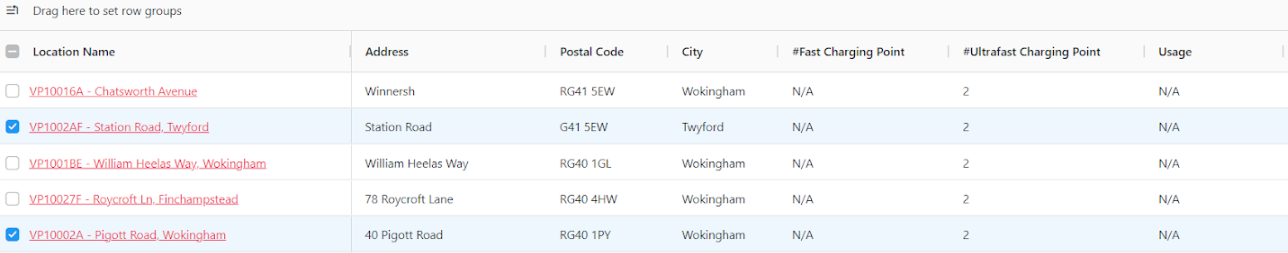
7. Exports your results
After analyzing the results, you can select the relevant locations that you want to export, by checking the box on the left of the location.
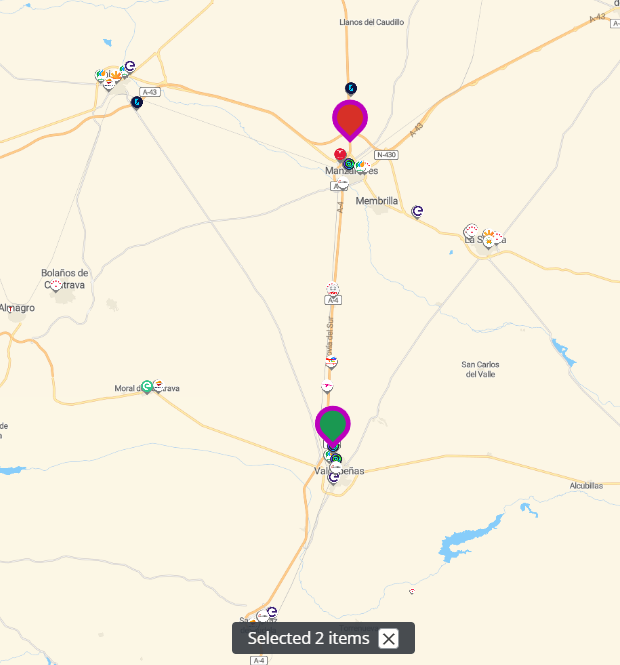
If you then go to the Map section you will see those selected locations highlighted in purple. Below the 'Map', you will also see a message 'Selected X items', indicating how many locations were highlighted. Please keep in mind that when you refresh the page, the selection will be gone.
Once the desired locations are selected, you will be able to export these results, by clicking on the Download button and on Export results option, the table will automatically be exported to Excel.