Find your hotpots: calculate a batch of new sites for optimal network expansion
This article will explain how you can process a list of tender locations and get a result for each of them in once. You can start from your baseline network or a previously saved simulation, and test the opening of new locations on this network in batch. Within this project, all uploaded locations are opened & calculated one by one on the given baseline network. This means there are no combination effects of opening all tender locations at the same time; which allows you to define your optimal hotspot list.
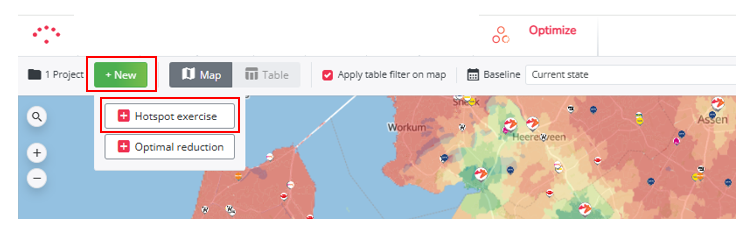
1. Create a new project
- Press the ‘New’ button. Next choose ‘Hotspot exercise’
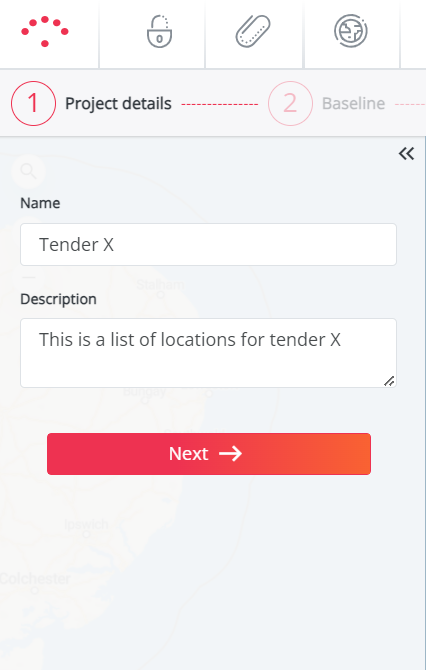
- Fill in the name of the project, enter a description (optional) and click on 'Next'
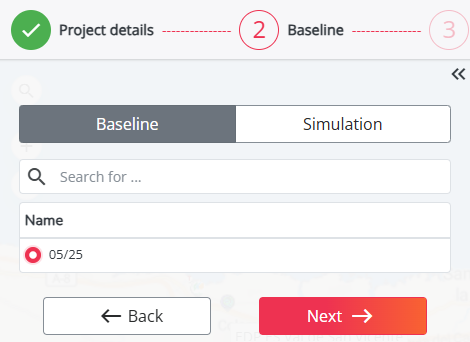
2. Choose your network
- Choose the network on which you want to test the batch of new locations, this can either be the baseline period or a saved simulation from the Location Planning module. Then click 'Next'
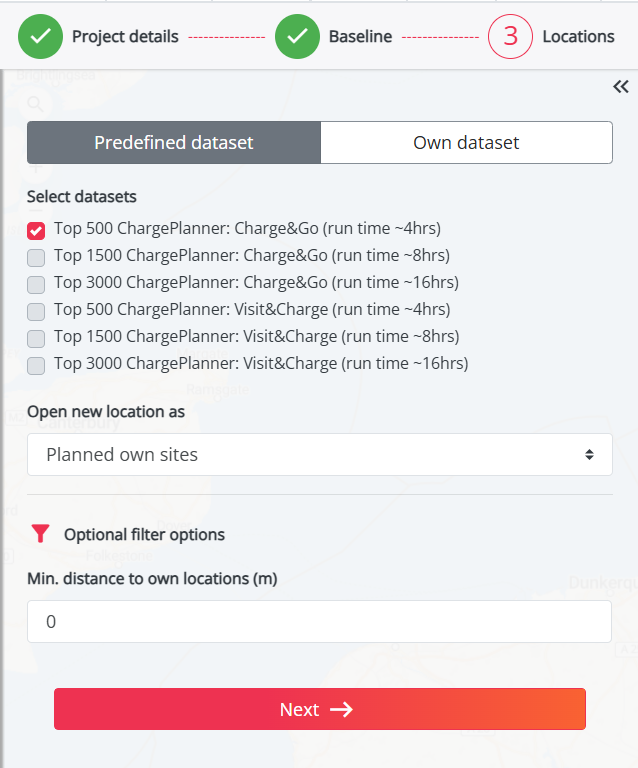
3. Choose your dataset
At this stage, you have two options:
Start from a predefined dataset
In this case you can use a predefined inspiration set provided by RetailSonar, if one is available on your platform or in your country. These inspiration sets give you direct access to a list of relevant locations to test. Select the one you want to test.
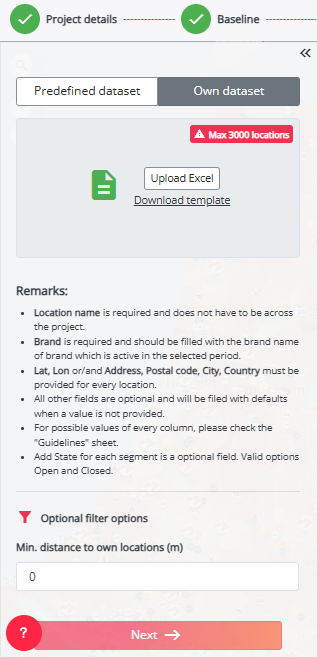
Start from your own dataset
You can also provide your own list of addresses to test in batch. To do this, download the provided (empty) Excel template and follow the step-by-step instructions in this article to prepare your list of locations.
(Optional) Add filters
You can define a buffer zone around your own locations by selecting the option "Minimum distance from your own sites (m)." This feature helps exclude potential locations within a certain distance, ensuring a more targeted analysis and preventing cannibalization.
4. Upload the excel to start the import
After choosing which dataset(s) to import or preparing your own list of locations to test, click on the 'Next' button to start the import. This might take a bit of time depending on the amount of addresses in your upload. If you import was successful, all locations will be added as markers on the map with a green plus. You can follow the progress of your import at any time by clicking on your username in the top right corner and selecting 'Jobs'.
It might be possible that the validation of the file fails. You will see this when the job has a red explanation mark next to it. If you want to know how to solve this, please check out this article.
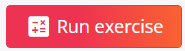
5. Calculate the exercise (after a successful import)
In order to calculate the potential of the new locations, click on the button 'Run exercise' on the top right of the screen.
The calculation will take approximately 1 hour for 100 sites, so around 5 hours for 500 sites. Once the calculation is finished, you receive a notification via email.
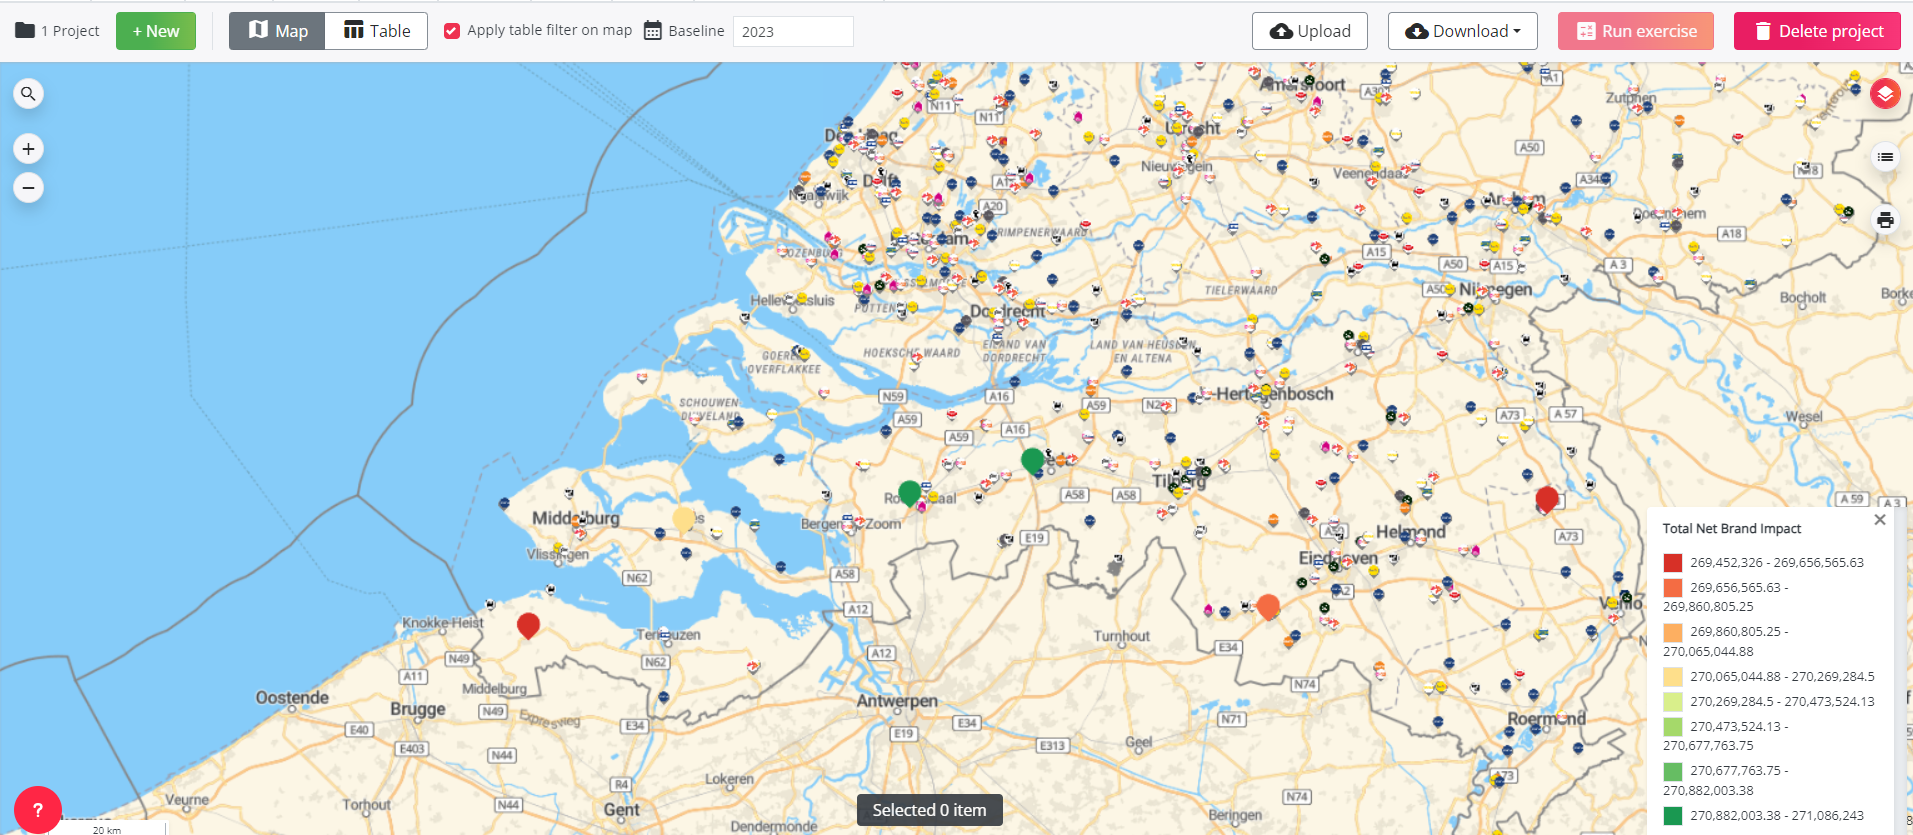
6. Validate your results
The Optimize module allows you to view the results on a map or in a table:
- The Map displays each tested location now in a color, from red to green. This represents the net brand impact of a location on the network as a whole. Red locations have a low net brand impact, while green locations have a high net brand impact.
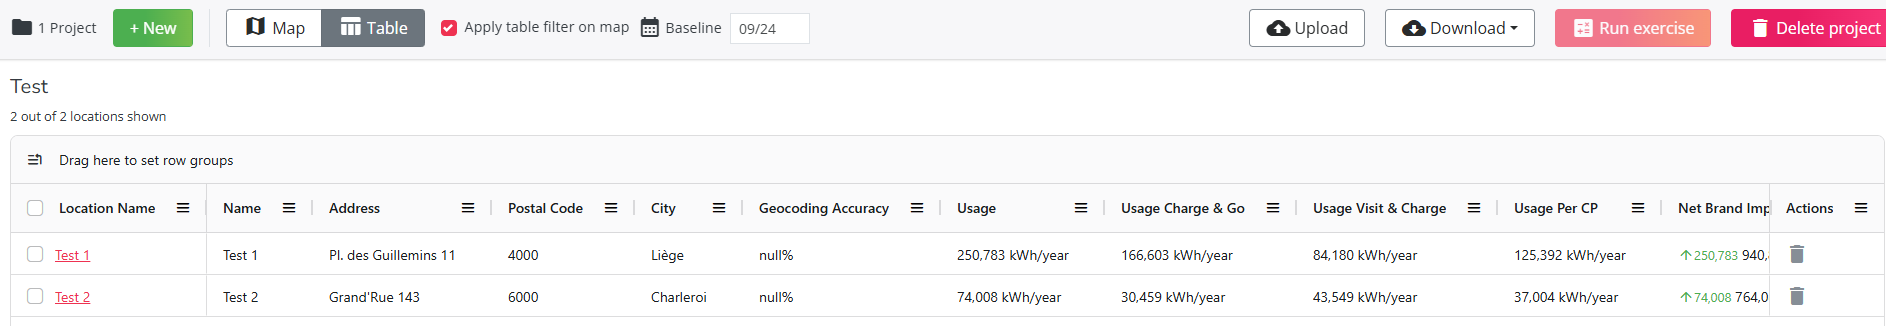
- In the Table, you will see the results for each location in the list as well as some extra context information such as:
- Usage (global and per segment)
- Impact on the brand
- Characteristics of the sites you loaded
- Local Activity per type
- Car passage
- Competition per type and travel times
- Developable public slow charging power
- Geocoding accuracy: will be null% if you used addresses based on latlon - you'll see a geocoding accuracy % when working with streetnames, postcal codes & cities
Please note that poor results might be related to bad road connections. Because our model works with travel times to calculate predictions, locations located in a large parking lot may lead to poor results. This is due to the fact that the location cannot connect well to the main access road. If this is the case, we recommend updating the travel times for those locations by selecting a road segment close to the entrance of the parking. This will lead to a more accurate result. Read more about how to do this in the following article
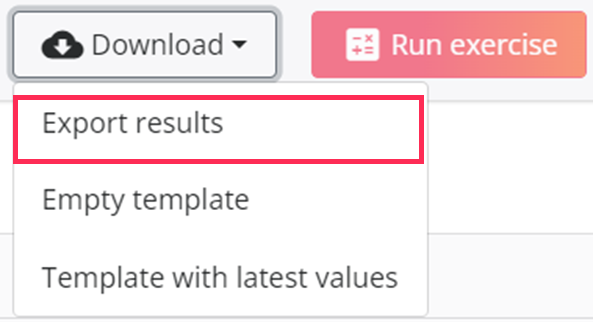
7. Exports your results
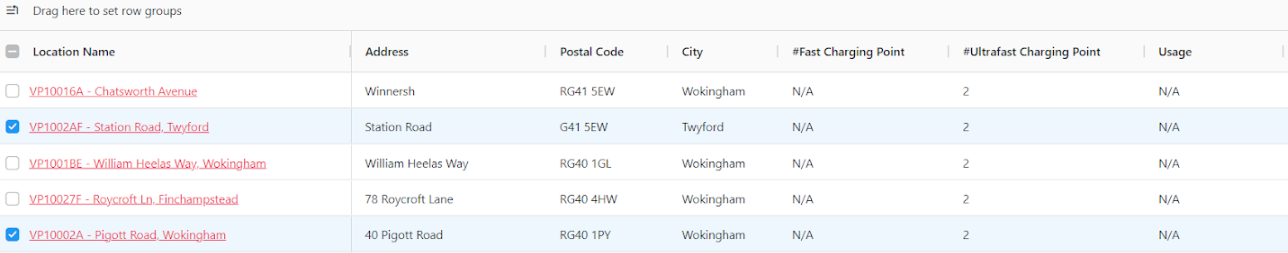
After analyzing the results, you can select the relevant locations that you want to export, by checking the box on the left of the location.
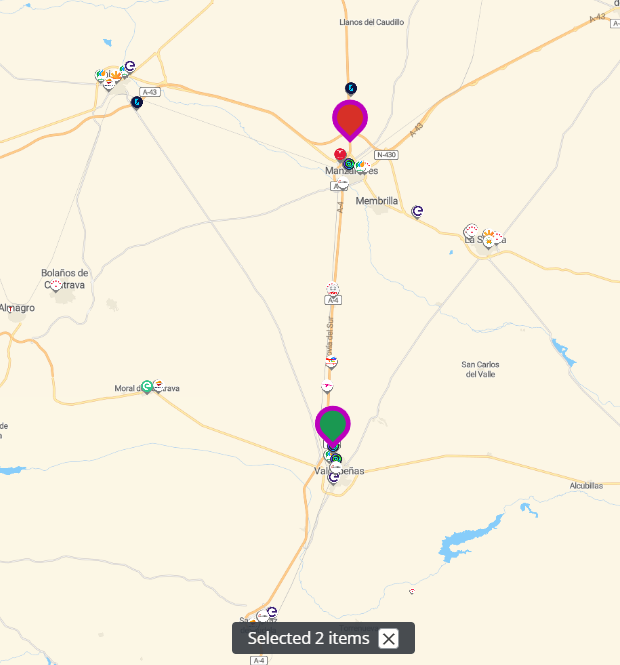
If you then go to the Map section you will see those selected locations highlighted in purple. Below the 'Map', you will also see a message 'Selected X items', indicating how many locations were highlighted. Please keep in mind that when you refresh the page, the selection will be gone.
Once the desired locations are selected, you will be able to export these results, by clicking on the Download button and on Export results option, the table will automatically be exported to Excel.