
Which actions can you take for underperforming and/or unprofitable locations w/o growth potenial?
Now that you've identified your underutilized locations, you want to know which actions you can take to improve performances.
For locations that are underperforming you will need to investigate what's causing this to identify the right growth opportunities. For locations that are flagged unprofitable and have no growth potential you can explore several real estate actions.
This article will guide you on how to use the opportunity framework to answer the above questions. Opportunity frameworks are NOT configured by default, additional data is needed to be able to configure this.
The first part of this article are the necessary basic steps to visualize the right network in the framework. Depending on your usecase, head straight to part 2 or 3 after.
1. Visualize the right network in the right framework
Step 1: Head to the Location Performance module.
Step 2: Select the latest updated framework by selecting the default framework. Then select the most recent baseline period with the sales data of your actual network.
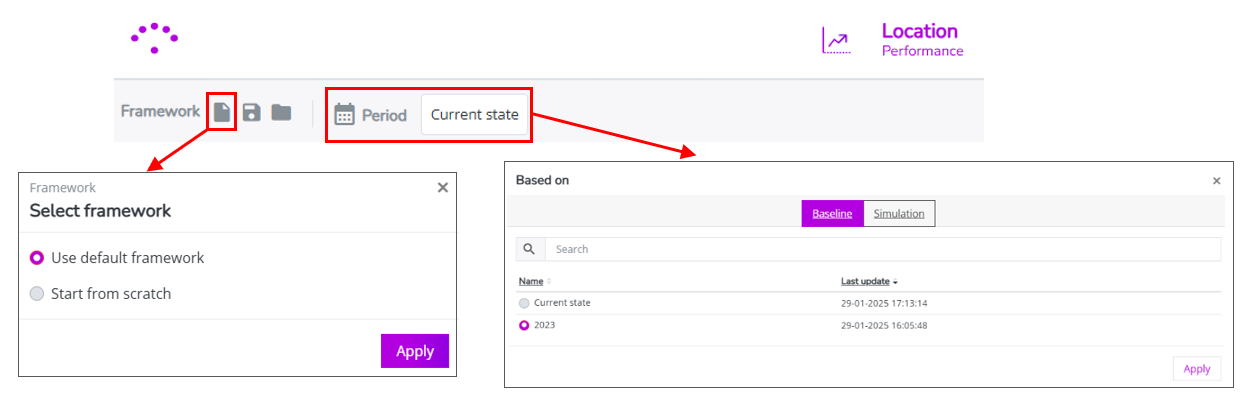
Step 3: Select the Opportunity framework tab.

2. Investigate the causes of underperforming locations
To uncover the causes of underperformance, we make use of the following building blocks in the opportunity framework:
- Location clusters: each existing location is assigned to a cluster in function of several similar micro- and macro environment indicators. If the clusters are based on data that is uploaded on the platform, you can see which indicators by clicking on the small arrow icon
next to the column name 'Cluster'. The sub columns will then open up displaying the data that was included to define the cluster.
- Explanatory sales KPIs grouped in 3 categories: Activation, Loyalty and Conversion.
These performance KPIs are derived either from your own data or provided by RetailSonar using mobile data. Please note that these KPIs are calculated exclusively for customers within the primary catchment area (unless if this is not possible due to data unavailability). This approach ensures that KPIs remain consistently comparable across locations.
- Suggested actions, based on easy ruling logic;
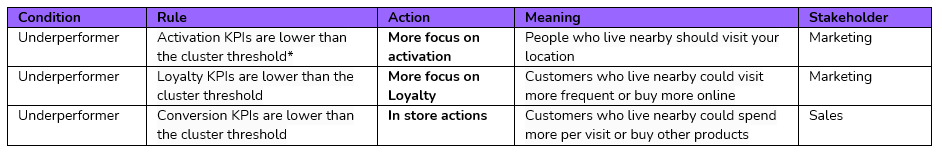
*The cluster threshold is the average value of the performance KPI per cluster.
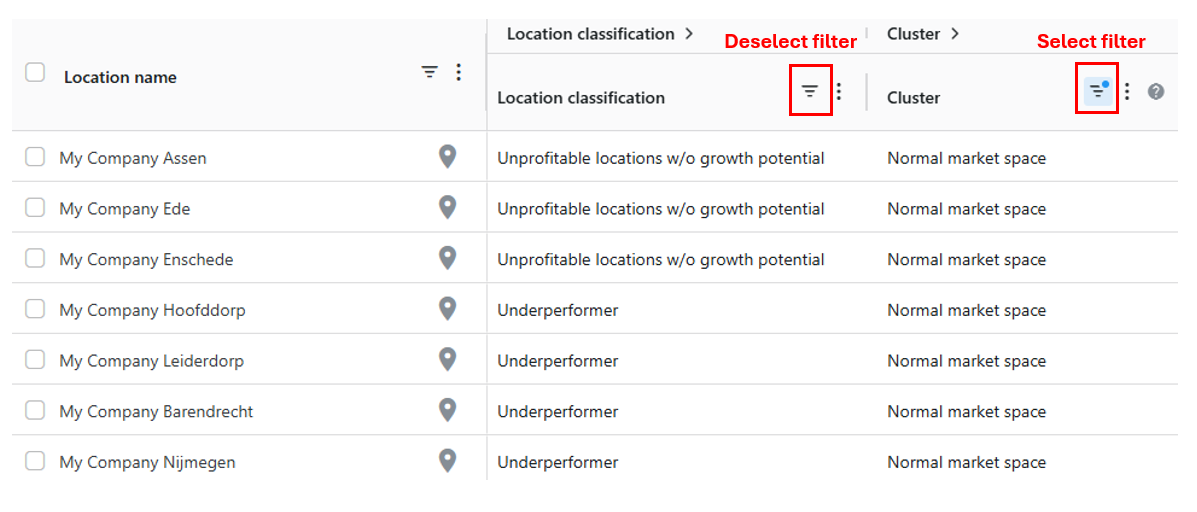
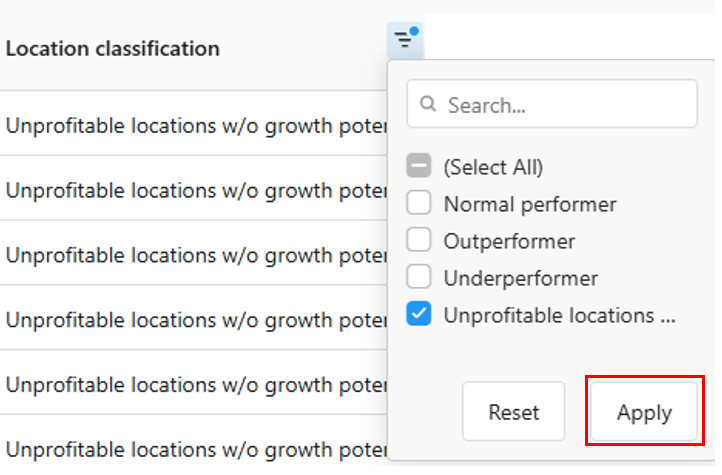
Step 1. Analyze the proposed actions for all underperforming locations. Select 'underperformers' in the location classification filter by clicking on the filter icon

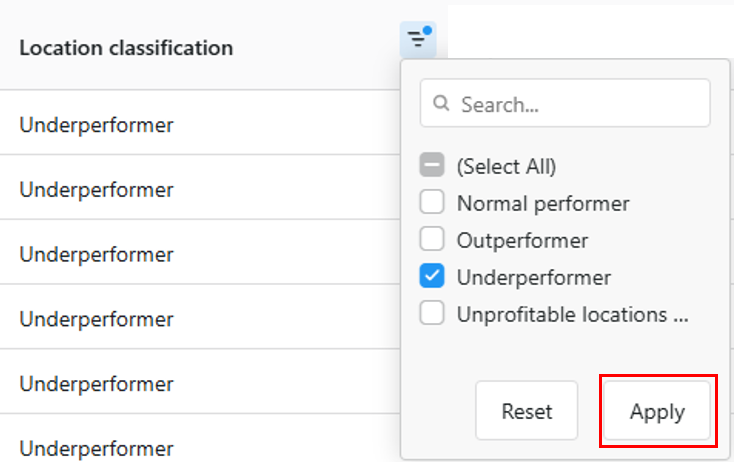
Immediately scroll to the right of the framework to see the proposed action for each underperforming location.
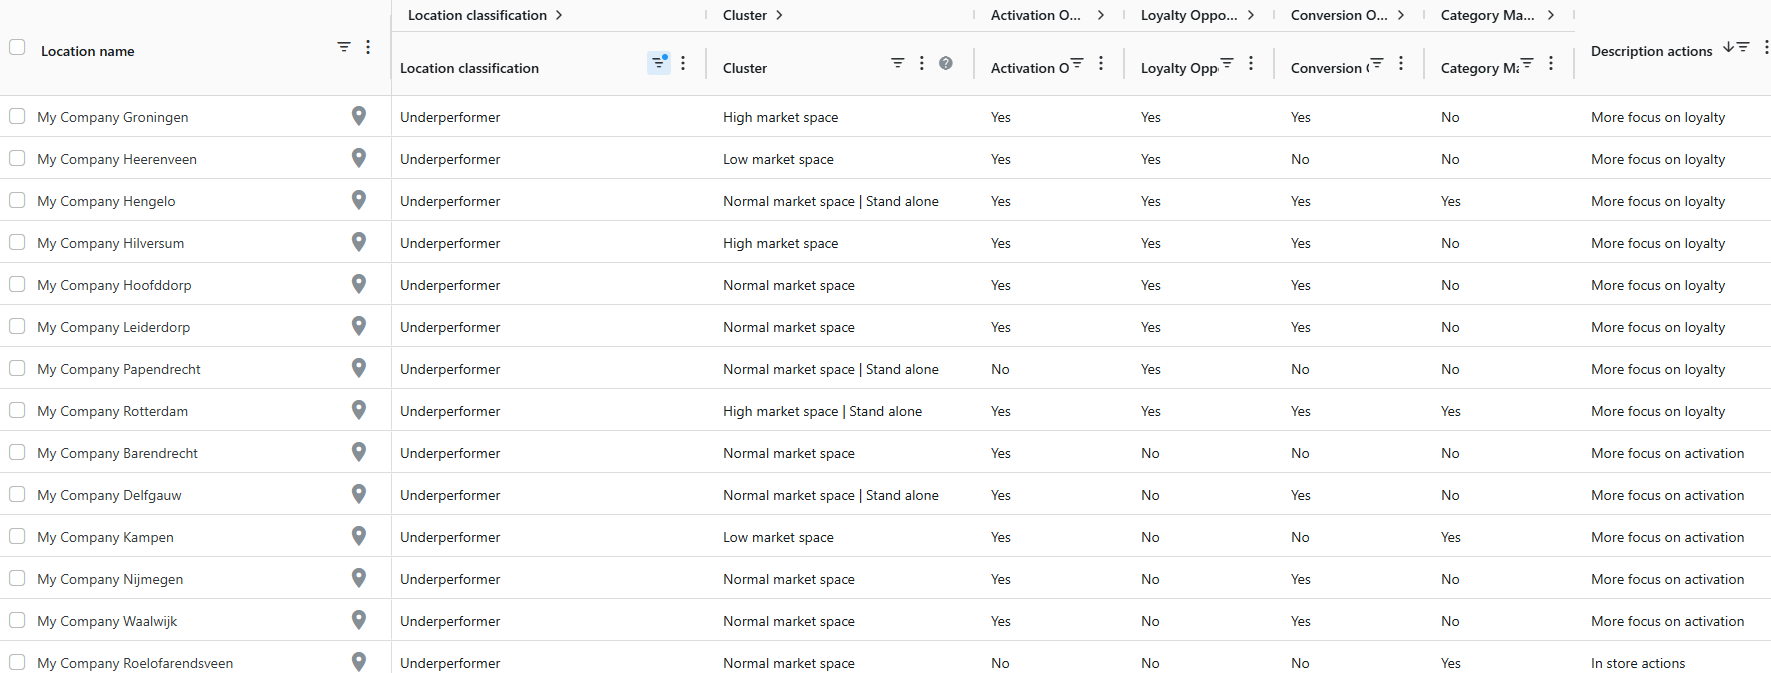
Step 2. For each underperforming location, validate the data in the opportunity framework and make use of additional analyses to refine the action plan. The actions based on the easy rulings already give some first indications. Additional insights (by benchmarking environments) are required to define the right action plan.
- Select one underperformer that you want to analyze in-depth
- Check in which cluster the location is categorized (if configured)
- Filter on that cluster by using that specific location filter (if configured). Make sure to deselect the location classification filter 'underperformers' from step 1. You want to visualize also the other performing locations from the cluster.
- Now check for each group of performance KPIs (activation, loyalty, conversion) the underlying indicators, one by one.
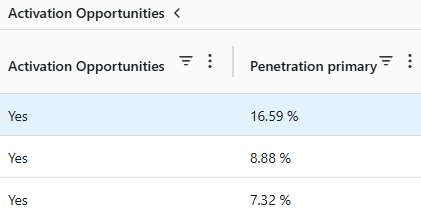
- For example to check the activation opportunities;
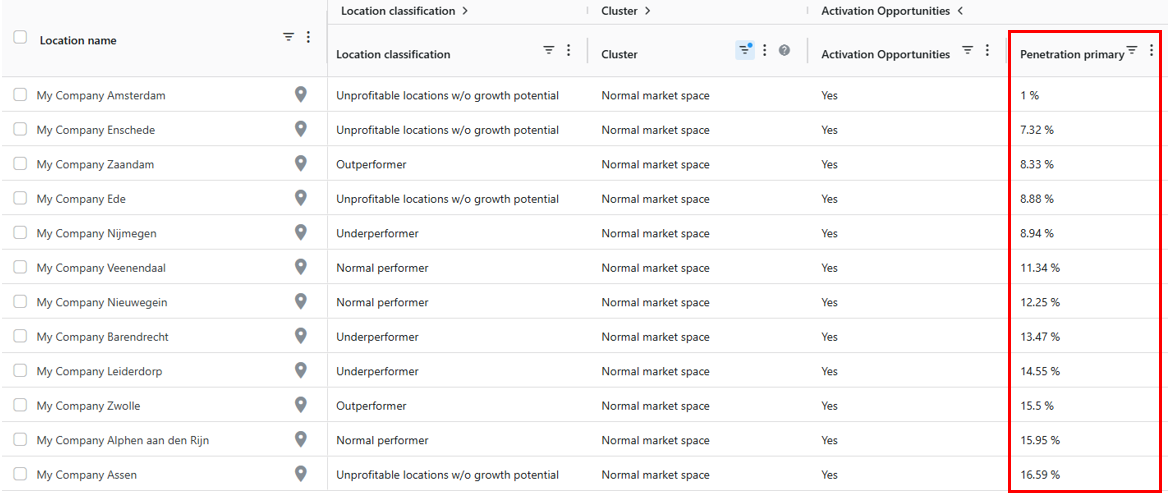
- Open up the activation column by clicking on the little arrow
so the activation indicators are displayed:
- Sort the activation indicator(s) column from high to low or the other way around. You can see how the underperformer relates to the other cluster locations considering this activation indicator. Perhaps all locations within a cluster have low values (such as the example on the image below), which makes this indicator “cluster dependent”. If that would be the case, then you should consider to change the proposed action.
TIP! You can also do this in excel. Click on the export () button to start the download. (Be aware that filters don't apply for downloads)
- Open up the activation column by clicking on the little arrow
- For example to check the activation opportunities;
5. Do this exercise for each type of indicator to identify the right opportunity and to refine the proposed action plan.
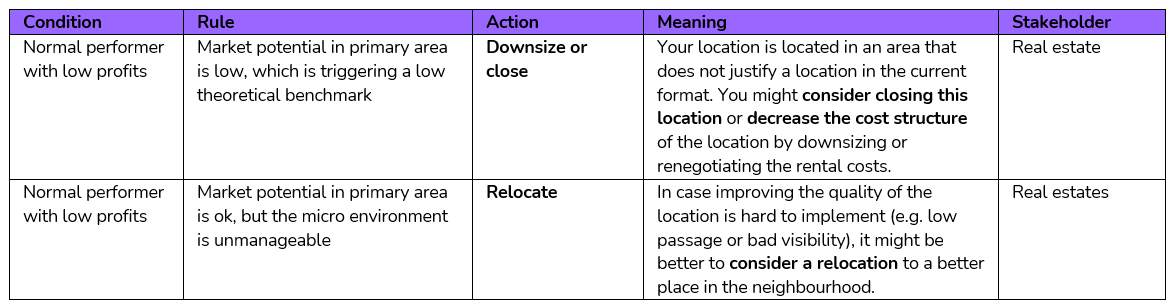
3. Explore real estate opportunities for unprofitable locations without growth potential
Step 1. Analyze the proposed actions for all unprofitable locations that have no growth potential. Select 'unprofitable locations w/o growth potential'' in the location classification filter by clicking on the filter icon
Immediately scroll to the right of the framework to see the proposed action for each unprofitable location.

The proposed actions are again based on easy ruling logic:
Step 2. For a complete view on the business case for unprofitable locations, it might be good to already simulate the location changes in the location planning module. Possible simulations you can create here:
- For downsizing: create a simulation where you edit/lower the surface, analyze the newly calculated performance
- For closures: create a closure simulation and analyze the added value of the location (what is the recuperation by the existing network?)
- For relocations: create a relocation simulation by closing the existing location and opening up a new location closeby but with improved/neutral location characteristics
- For improved location characteristics: create a simulation where you edit the improved location characteristic of an existing location; analyze the uplift in performance to see whether it's worth the investment.
Do this before reporting the opportunity to the right stakeholder.